Stephens Annual Bank Forum September 17, 2025 Symbol: FNWD (NASDAQ-Traded)
2 Important Information Forward-Looking Statements This presentation may contain forward-looking statements regarding the financial performance, business prospects, growth and operating strategies of Finward Bancorp (“FNWD”). For these statements, FNWD claims the protections of the safe harbor for forward-looking statements contained in the Private Securities Litigation Reform Act of 1995. Statements in this communication should be considered in conjunction with the other information available about FNWD, including the information in the filings FNWD makes with the Securities and Exchange Commission (“SEC”). Forward-looking statements provide current expectations or forecasts of future events and are not guarantees of future performance. The forward-looking statements are based on management’s expectations and are subject to a number of risks and uncertainties. Forward-looking statements are typically identified by using words such as “anticipate,” “estimate,” “project,” “intend,” “plan,” “believe,” “will” and similar expressions in connection with any discussion of future operating or financial performance. Although management believes that the expectations reflected in such forward-looking statements are reasonable, actual results may differ materially from those expressed or implied in such statements. Risks and uncertainties that could cause actual results to differ materially include: changes in domestic and international trade policies, including tariffs and other non-tariff barriers, and the effects of such changes on the Bank and its customers; risks related to the development and use of artificial intelligence (AI); the ability of Peoples Bank (the "Bank") to demonstrate compliance with the terms of the previously disclosed memorandum of understanding entered into between the Bank and the Federal Deposit Insurance Corporation ("FDIC") and the Indiana Department of Financial Institutions ("DFI"), or to demonstrate compliance to the satisfaction of the FDIC and/or DFI within prescribed time frames; the Bank's agreement under the memorandum of understanding to refrain from paying cash dividends without prior regulatory approval; changes in asset quality and credit risk; the inability to sustain revenue and earnings growth; changes in interest rates, market liquidity, and capital markets, as well as the magnitude of such changes, which may reduce net interest margins; continuing effects of inflation; further deterioration in the market value of securities held in FNWD’s investment securities portfolio, whether as a result of macroeconomic factors or otherwise; customer acceptance of FNWD’s products and services; customer borrowing, repayment, investment, and deposit practices; customer disintermediation; the introduction, withdrawal, success, and timing of business initiatives; competitive conditions; the inability to realize cost savings or revenues or to implement integration plans and other consequences associated with mergers, acquisitions, and divestitures; economic conditions; and the impact, extent, and timing of technological changes, capital management activities, and other actions of the Federal Reserve Board and legislative and regulatory actions and reforms. Additional factors that could cause actual results to differ materially from those expressed in the forward-looking statements are discussed in FNWD’s reports (such as the Annual Report on Form 10-K, Quarterly Reports on Form 10-Q, and Current Reports on Form 8-K) filed with the SEC and available at the SEC’s Internet website (www.sec.gov). All subsequent written and oral forward-looking statements concerning matters attributable to FNWD or any person acting on its behalf are expressly qualified in their entirety by the cautionary statements above. Except as required by law, FNWD does not undertake any obligation to update any forward-looking statement to reflect circumstances or events that occur after the date the forward-looking statement is made. In addition to the above factors, we also caution that the actual amounts and timing of any future common stock dividends or share repurchases will be subject to various factors, including our capital position, financial performance, capital impacts of strategic initiatives, market conditions, and regulatory and accounting considerations, as well as any other factors that our Board of Directors deems relevant in making such a determination. Therefore, there can be no assurance that we will repurchase shares or pay any dividends to holders of our common stock, or as to the amount of any such repurchases or dividends. Disclosures Regarding Non-GAAP Measures This presentation refers to certain financial measures that are identified as non-GAAP. FNWD believes that these non-GAAP measures are helpful to investors to better understand FNWD’s assets, earnings, and shareholders’ equity at the date of this presentation. This supplemental information should not be considered in isolation or as a substitute for the related GAAP measures. See the attached table at the end of this presentation for a reconciliation of the non-GAAP measures identified herein and their most comparable GAAP measures. September 2025
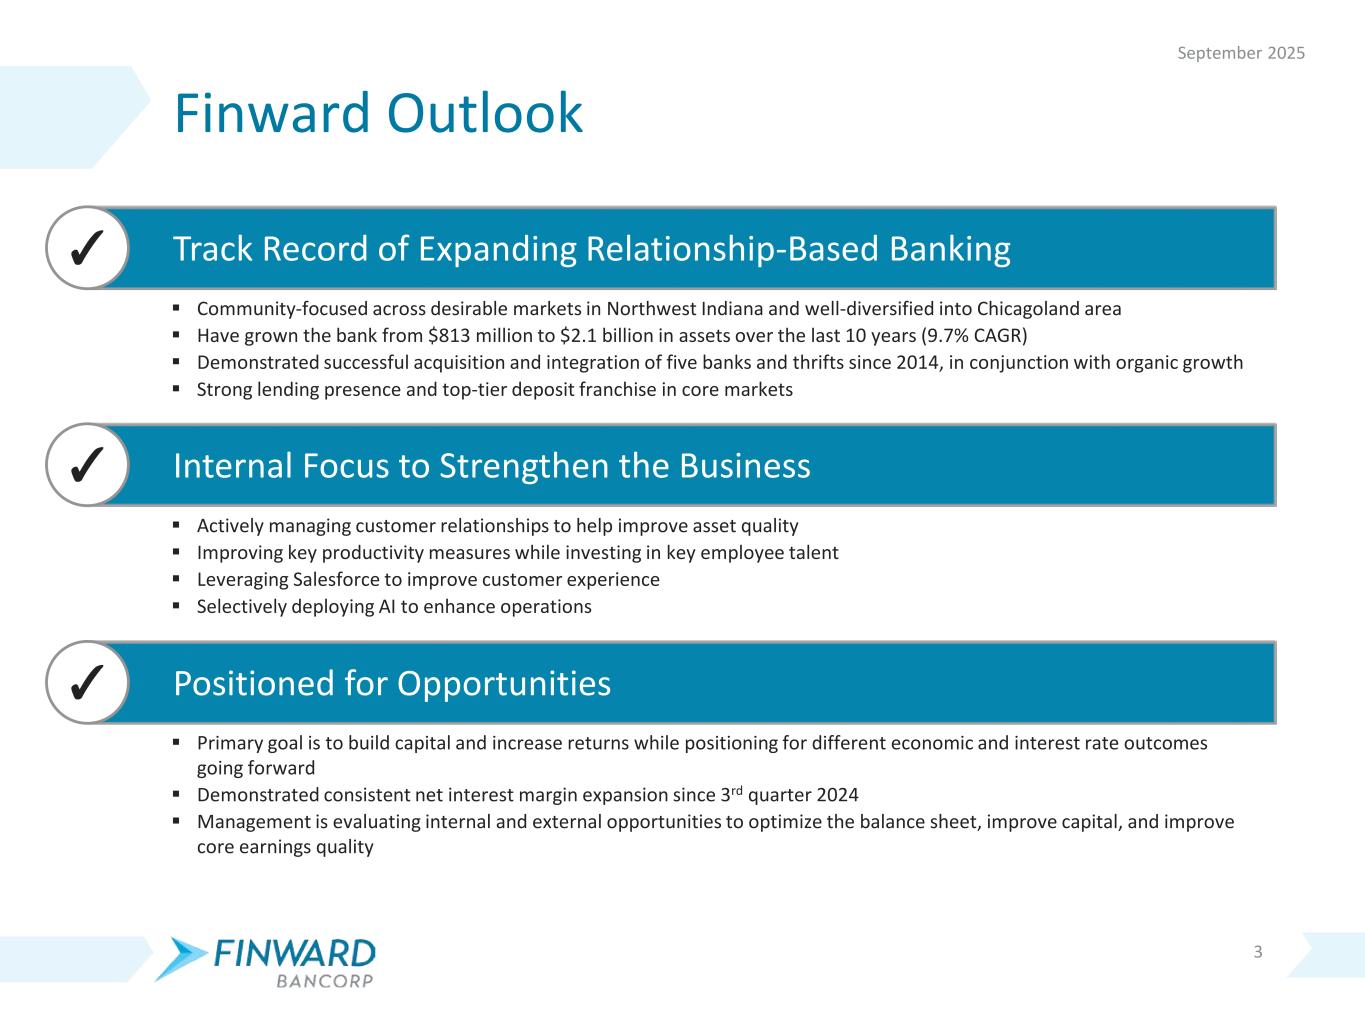
3 Finward Outlook Internal Focus to Strengthen the Business Positioned for Opportunities Track Record of Expanding Relationship-Based Banking ✓ ✓ ✓ Community-focused across desirable markets in Northwest Indiana and well-diversified into Chicagoland area Have grown the bank from $813 million to $2.1 billion in assets over the last 10 years (9.7% CAGR) Demonstrated successful acquisition and integration of five banks and thrifts since 2014, in conjunction with organic growth Strong lending presence and top-tier deposit franchise in core markets Actively managing customer relationships to help improve asset quality Improving key productivity measures while investing in key employee talent Leveraging Salesforce to improve customer experience Selectively deploying AI to enhance operations Primary goal is to build capital and increase returns while positioning for different economic and interest rate outcomes going forward Demonstrated consistent net interest margin expansion since 3rd quarter 2024 Management is evaluating internal and external opportunities to optimize the balance sheet, improve capital, and improve core earnings quality September 2025
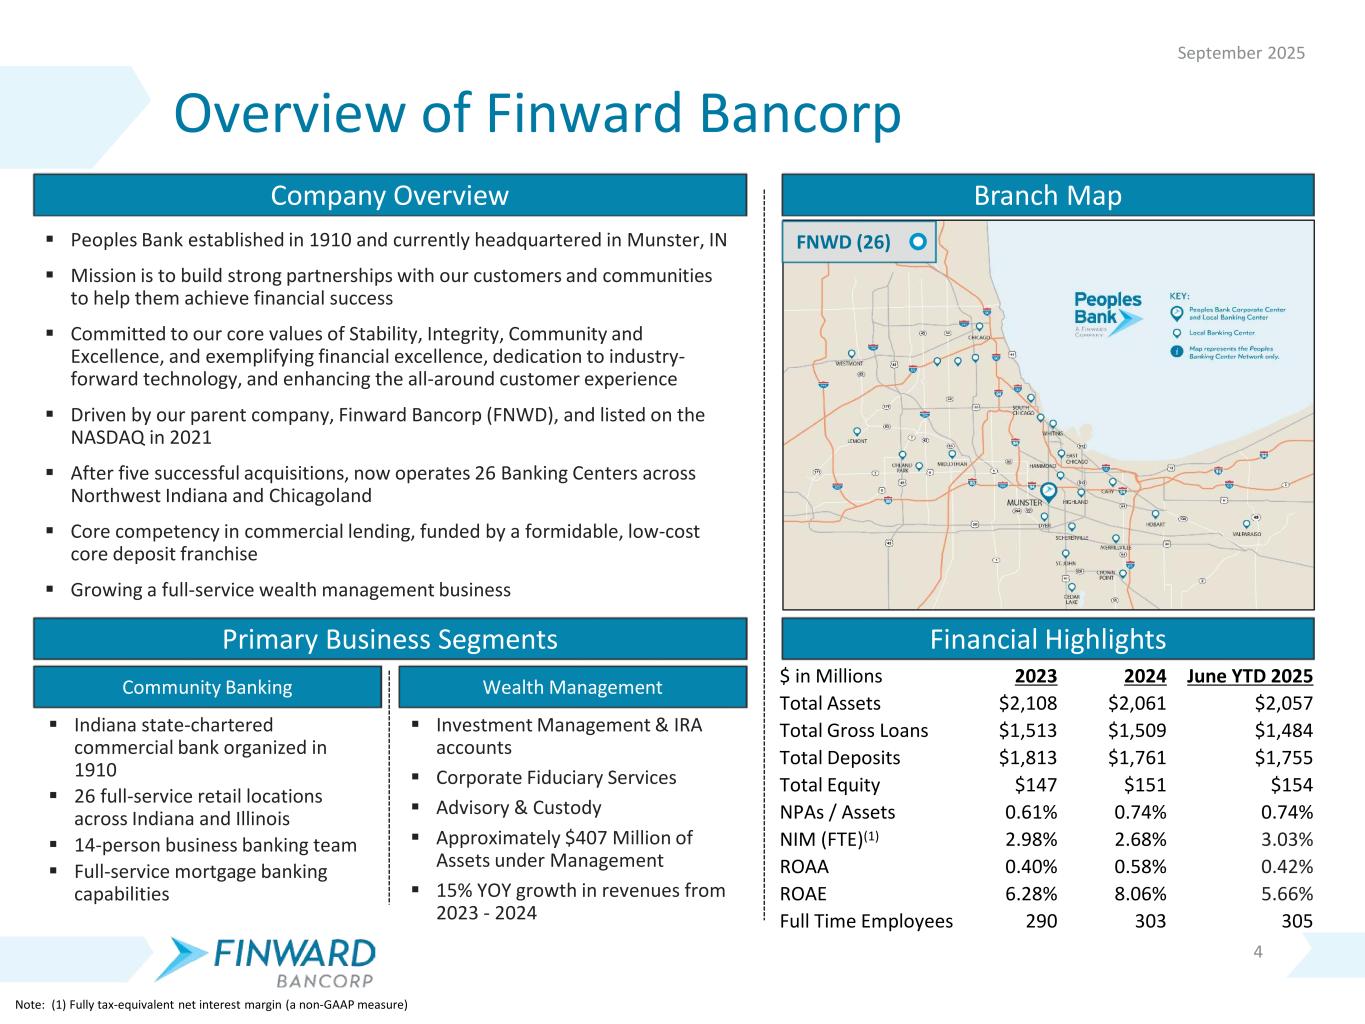
4 Overview of Finward Bancorp Company Overview Branch Map FNWD (26) September 2025 Note: (1) Fully tax-equivalent net interest margin (a non-GAAP measure) Financial HighlightsPrimary Business Segments Community Banking Wealth Management Indiana state-chartered commercial bank organized in 1910 26 full-service retail locations across Indiana and Illinois 14-person business banking team Full-service mortgage banking capabilities Investment Management & IRA accounts Corporate Fiduciary Services Advisory & Custody Approximately $407 Million of Assets under Management 15% YOY growth in revenues from 2023 - 2024 $ in Millions 2023 2024 June YTD 2025 Total Assets $2,108 $2,061 $2,057 Total Gross Loans $1,513 $1,509 $1,484 Total Deposits $1,813 $1,761 $1,755 Total Equity $147 $151 $154 NPAs / Assets 0.61% 0.74% 0.74% NIM (FTE)(1) 2.98% 2.68% 3.03% ROAA 0.40% 0.58% 0.42% ROAE 6.28% 8.06% 5.66% Full Time Employees 290 303 305 Peoples Bank established in 1910 and currently headquartered in Munster, IN Mission is to build strong partnerships with our customers and communities to help them achieve financial success Committed to our core values of Stability, Integrity, Community and Excellence, and exemplifying financial excellence, dedication to industry- forward technology, and enhancing the all-around customer experience Driven by our parent company, Finward Bancorp (FNWD), and listed on the NASDAQ in 2021 After five successful acquisitions, now operates 26 Banking Centers across Northwest Indiana and Chicagoland Core competency in commercial lending, funded by a formidable, low-cost core deposit franchise Growing a full-service wealth management business
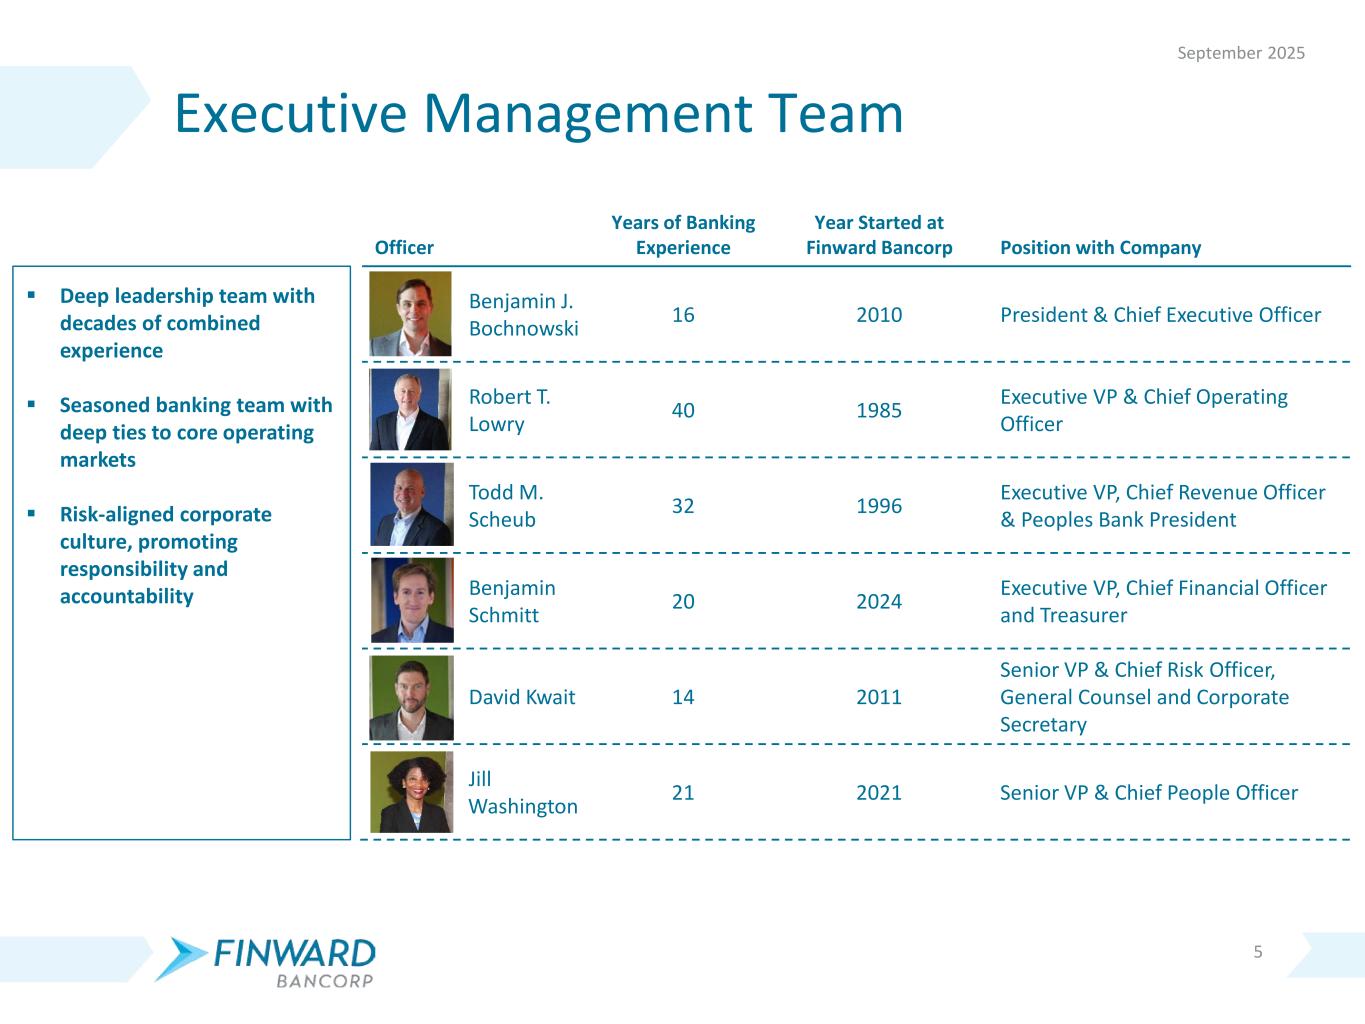
5 Executive Management Team Officer Years of Banking Experience Year Started at Finward Bancorp Position with Company Benjamin J. Bochnowski 16 2010 President & Chief Executive Officer Robert T. Lowry 40 1985 Executive VP & Chief Operating Officer Todd M. Scheub 32 1996 Executive VP, Chief Revenue Officer & Peoples Bank President Benjamin Schmitt 20 2024 Executive VP, Chief Financial Officer and Treasurer David Kwait 14 2011 Senior VP & Chief Risk Officer, General Counsel and Corporate Secretary Jill Washington 21 2021 Senior VP & Chief People Officer Deep leadership team with decades of combined experience Seasoned banking team with deep ties to core operating markets Risk-aligned corporate culture, promoting responsibility and accountability September 2025
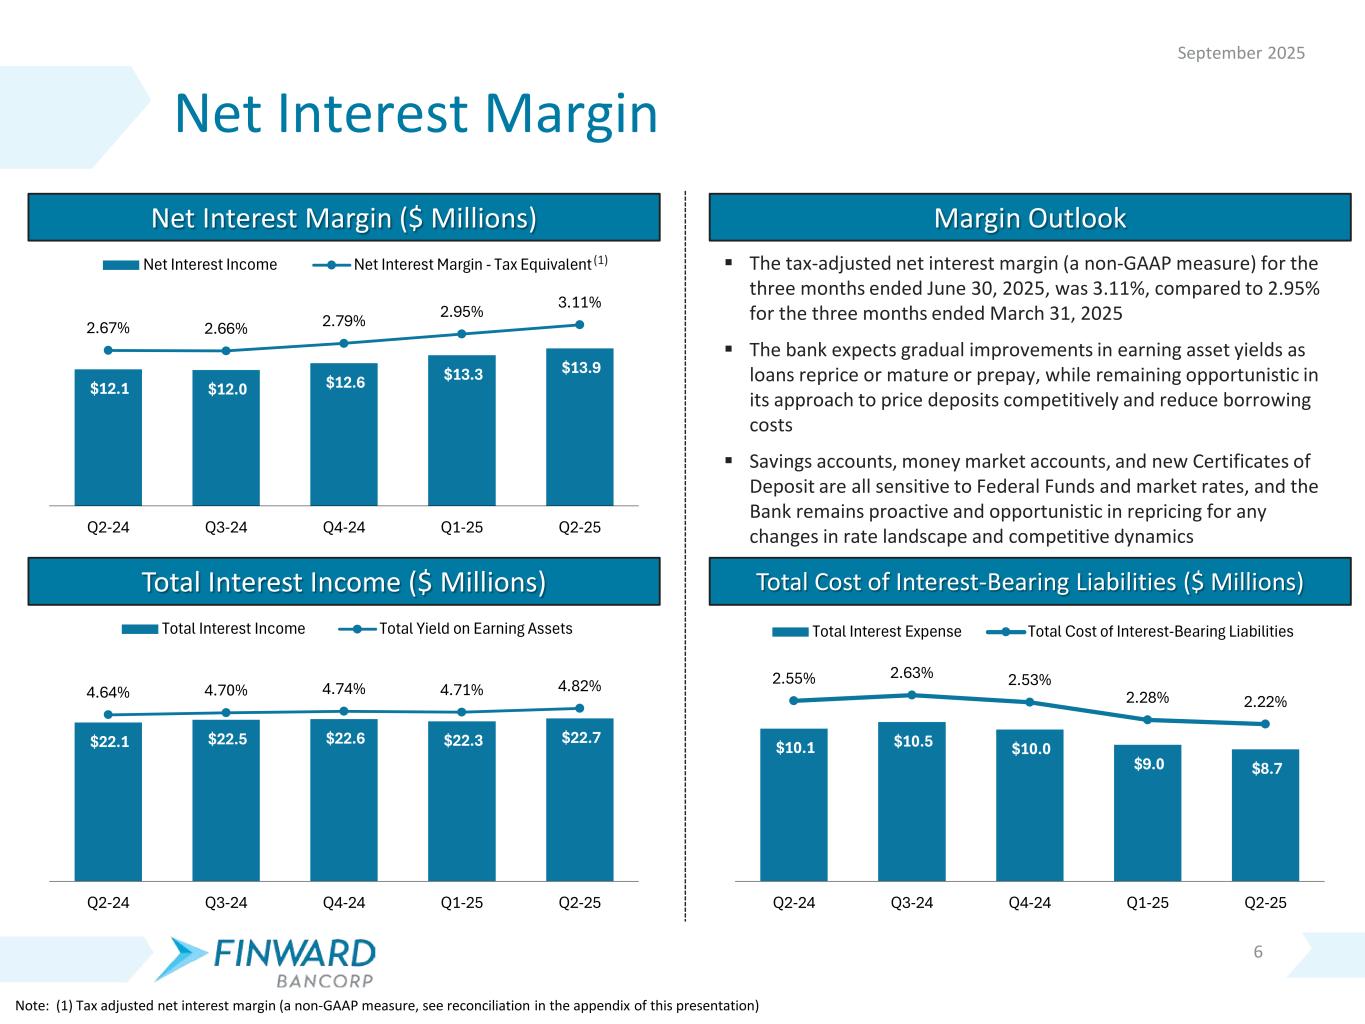
Net Interest Margin 6 September 2025 Net Interest Margin ($ Millions) Margin Outlook Total Interest Income ($ Millions) Total Cost of Interest-Bearing Liabilities ($ Millions) Note: (1) Tax adjusted net interest margin (a non-GAAP measure, see reconciliation in the appendix of this presentation) The tax-adjusted net interest margin (a non-GAAP measure) for the three months ended June 30, 2025, was 3.11%, compared to 2.95% for the three months ended March 31, 2025 The bank expects gradual improvements in earning asset yields as loans reprice or mature or prepay, while remaining opportunistic in its approach to price deposits competitively and reduce borrowing costs Savings accounts, money market accounts, and new Certificates of Deposit are all sensitive to Federal Funds and market rates, and the Bank remains proactive and opportunistic in repricing for any changes in rate landscape and competitive dynamics (1) $12.1 $12.0 $12.6 $13.3 $13.9 2.67% 2.66% 2.79% 2.95% 3.11% Q2-24 Q3-24 Q4-24 Q1-25 Q2-25 Net Interest Income Net Interest Margin - Tax Equivalent $22.1 $22.5 $22.6 $22.3 $22.7 4.64% 4.70% 4.74% 4.71% 4.82% Q2-24 Q3-24 Q4-24 Q1-25 Q2-25 Total Interest Income Total Yield on Earning Assets $10.1 $10.5 $10.0 $9.0 $8.7 2.55% 2.63% 2.53% 2.28% 2.22% Q2-24 Q3-24 Q4-24 Q1-25 Q2-25 Total Interest Expense Total Cost of Interest-Bearing Liabilities
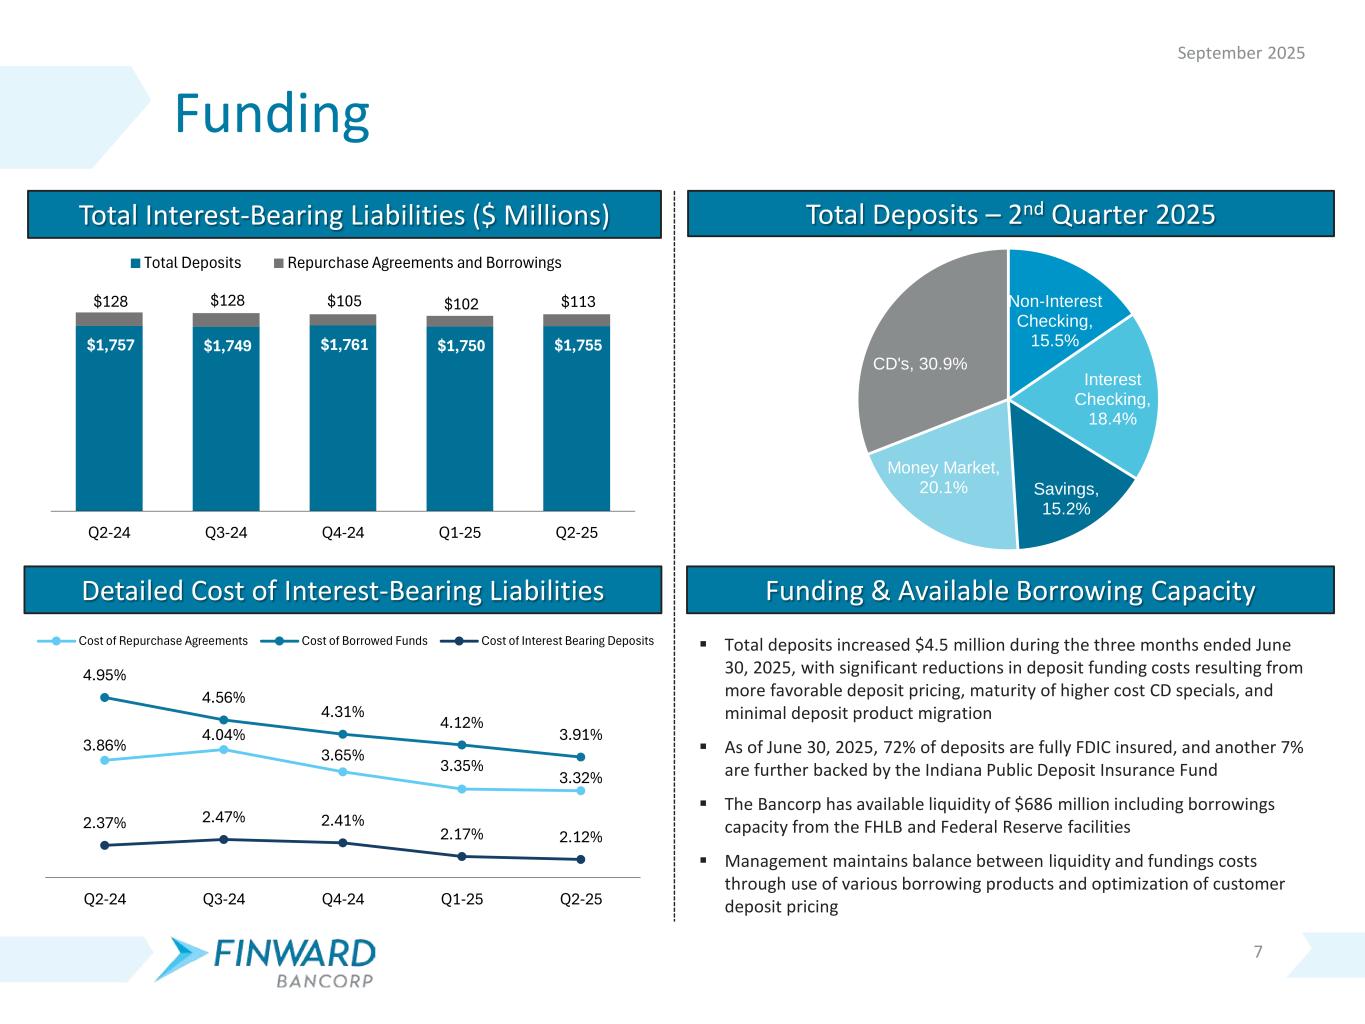
7 Funding September 2025 Detailed Cost of Interest-Bearing Liabilities Funding & Available Borrowing Capacity Total Interest-Bearing Liabilities ($ Millions) Total Deposits – 2nd Quarter 2025 Total deposits increased $4.5 million during the three months ended June 30, 2025, with significant reductions in deposit funding costs resulting from more favorable deposit pricing, maturity of higher cost CD specials, and minimal deposit product migration As of June 30, 2025, 72% of deposits are fully FDIC insured, and another 7% are further backed by the Indiana Public Deposit Insurance Fund The Bancorp has available liquidity of $686 million including borrowings capacity from the FHLB and Federal Reserve facilities Management maintains balance between liquidity and fundings costs through use of various borrowing products and optimization of customer deposit pricing $1,757 $1,749 $1,761 $1,750 $1,755 $128 $128 $105 $102 $113 Q2-24 Q3-24 Q4-24 Q1-25 Q2-25 Total Deposits Repurchase Agreements and Borrowings 3.86% 4.04% 3.65% 3.35% 3.32% 4.95% 4.56% 4.31% 4.12% 3.91% 2.37% 2.47% 2.41% 2.17% 2.12% Q2-24 Q3-24 Q4-24 Q1-25 Q2-25 Cost of Repurchase Agreements Cost of Borrowed Funds Cost of Interest Bearing Deposits Non-Interest Checking, 15.5% Interest Checking, 18.4% Savings, 15.2% Money Market, 20.1% CD's, 30.9%
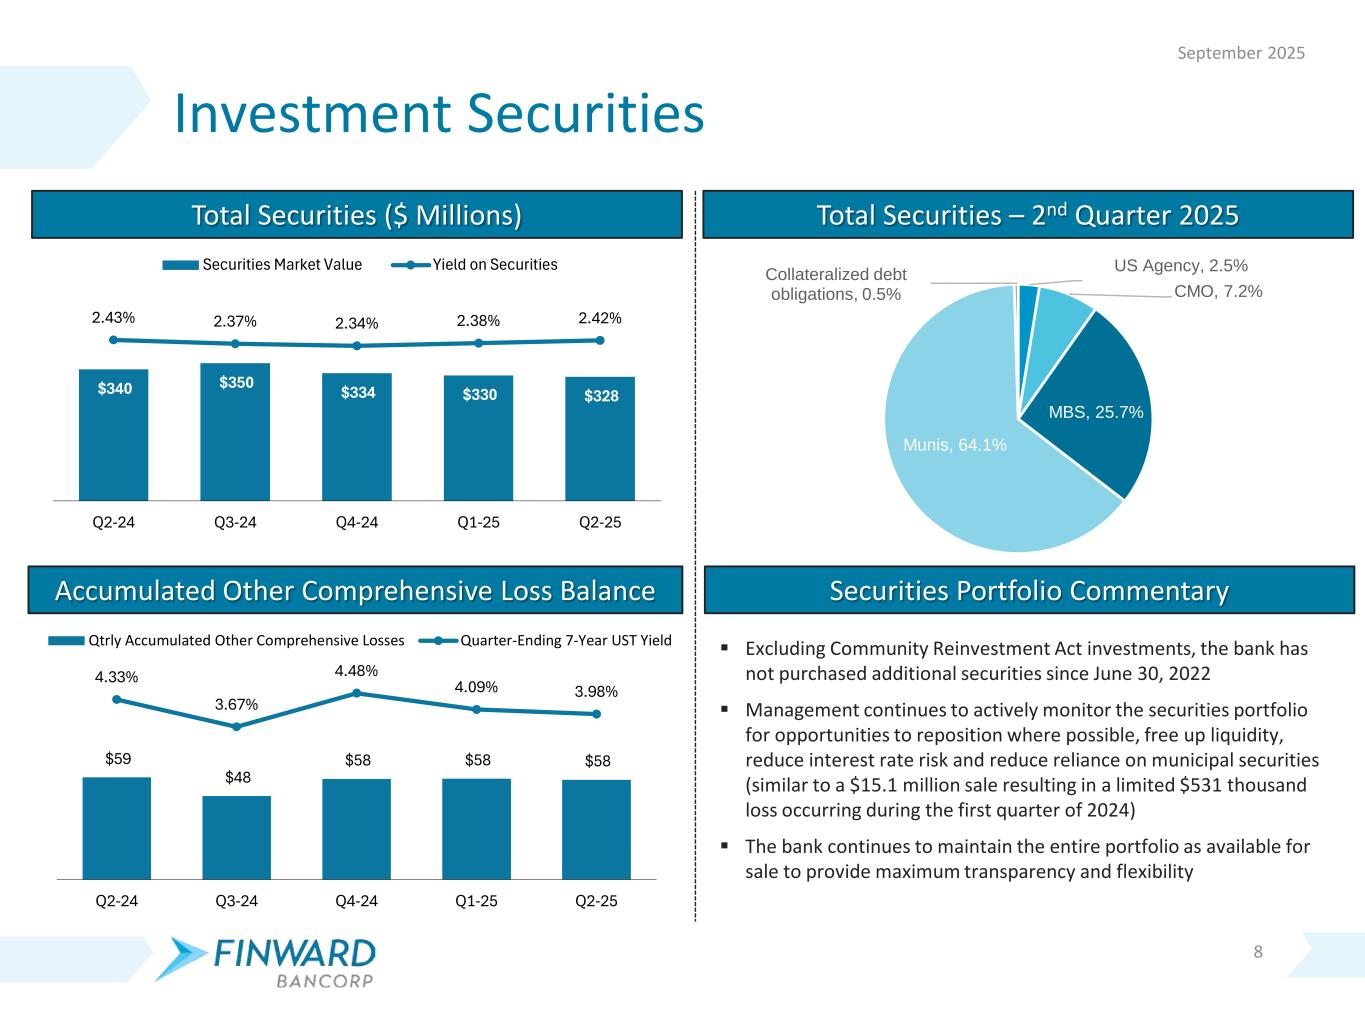
8 Investment Securities September 2025 Accumulated Other Comprehensive Loss Balance Securities Portfolio Commentary Total Securities ($ Millions) Total Securities – 2nd Quarter 2025 Excluding Community Reinvestment Act investments, the bank has not purchased additional securities since June 30, 2022 Management continues to actively monitor the securities portfolio for opportunities to reposition where possible, free up liquidity, reduce interest rate risk and reduce reliance on municipal securities (similar to a $15.1 million sale resulting in a limited $531 thousand loss occurring during the first quarter of 2024) The bank continues to maintain the entire portfolio as available for sale to provide maximum transparency and flexibility $340 $350 $334 $330 $328 2.43% 2.37% 2.34% 2.38% 2.42% Q2-24 Q3-24 Q4-24 Q1-25 Q2-25 Securities Market Value Yield on Securities $59 $48 $58 $58 $58 4.33% 3.67% 4.48% 4.09% 3.98% Q2-24 Q3-24 Q4-24 Q1-25 Q2-25 Qtrly Accumulated Other Comprehensive Losses Quarter-Ending 7-Year UST Yield US Agency, 2.5% CMO, 7.2% MBS, 25.7% Munis, 64.1% Collateralized debt obligations, 0.5%
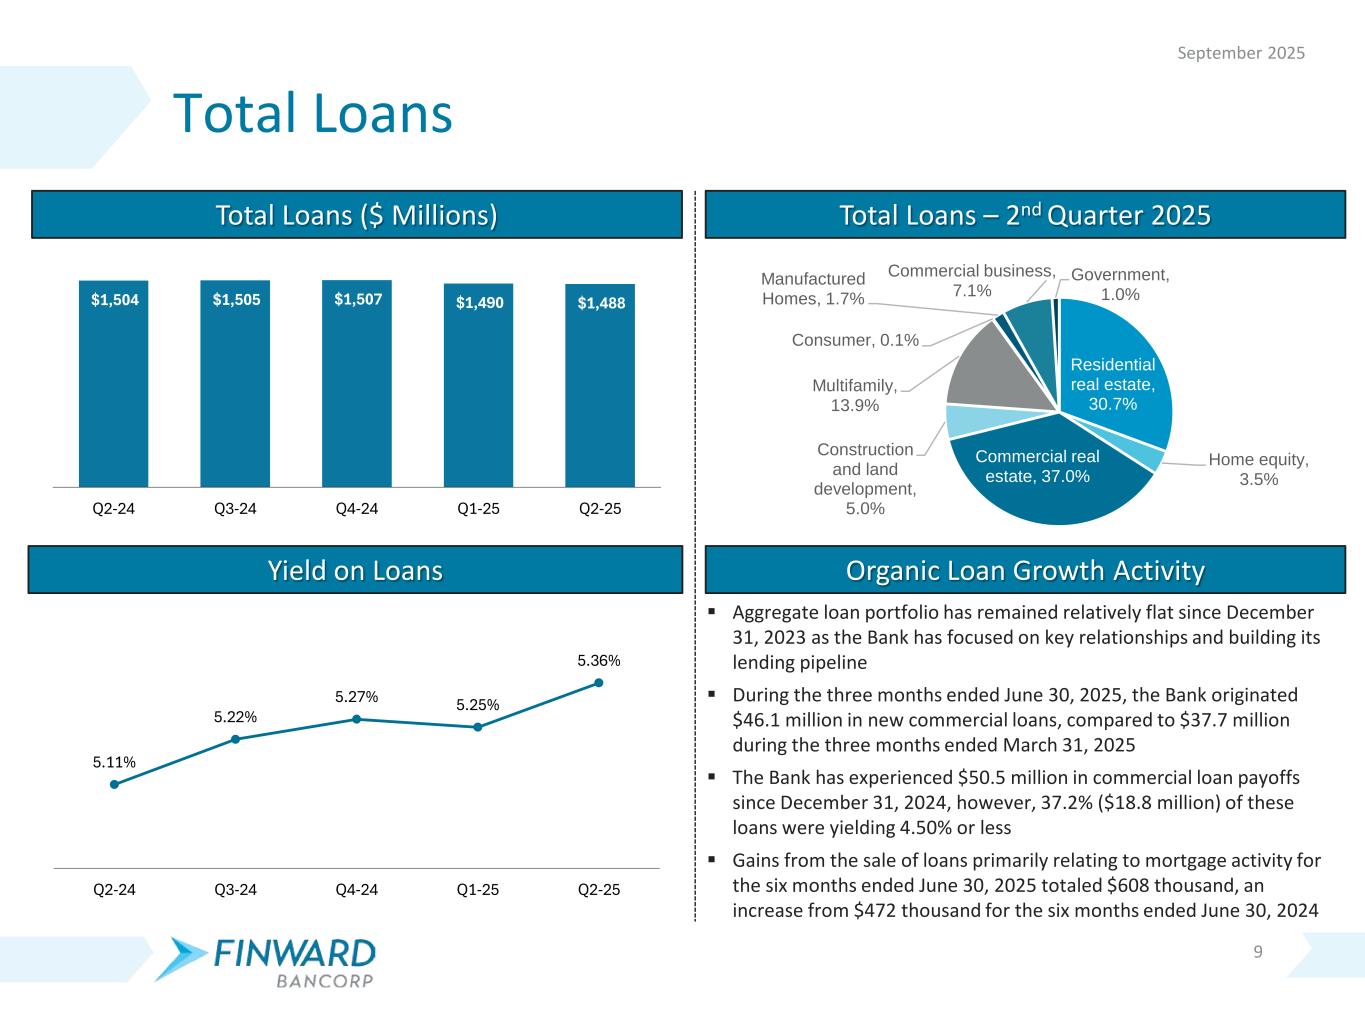
9 Total Loans September 2025 Yield on Loans Organic Loan Growth Activity Total Loans ($ Millions) Total Loans – 2nd Quarter 2025 Aggregate loan portfolio has remained relatively flat since December 31, 2023 as the Bank has focused on key relationships and building its lending pipeline During the three months ended June 30, 2025, the Bank originated $46.1 million in new commercial loans, compared to $37.7 million during the three months ended March 31, 2025 The Bank has experienced $50.5 million in commercial loan payoffs since December 31, 2024, however, 37.2% ($18.8 million) of these loans were yielding 4.50% or less Gains from the sale of loans primarily relating to mortgage activity for the six months ended June 30, 2025 totaled $608 thousand, an increase from $472 thousand for the six months ended June 30, 2024 $1,504 $1,505 $1,507 $1,490 $1,488 Q2-24 Q3-24 Q4-24 Q1-25 Q2-25 5.11% 5.22% 5.27% 5.25% 5.36% Q2-24 Q3-24 Q4-24 Q1-25 Q2-25 Residential real estate, 30.7% Home equity, 3.5% Commercial real estate, 37.0% Construction and land development, 5.0% Multifamily, 13.9% Consumer, 0.1% Manufactured Homes, 1.7% Commercial business, 7.1% Government, 1.0%
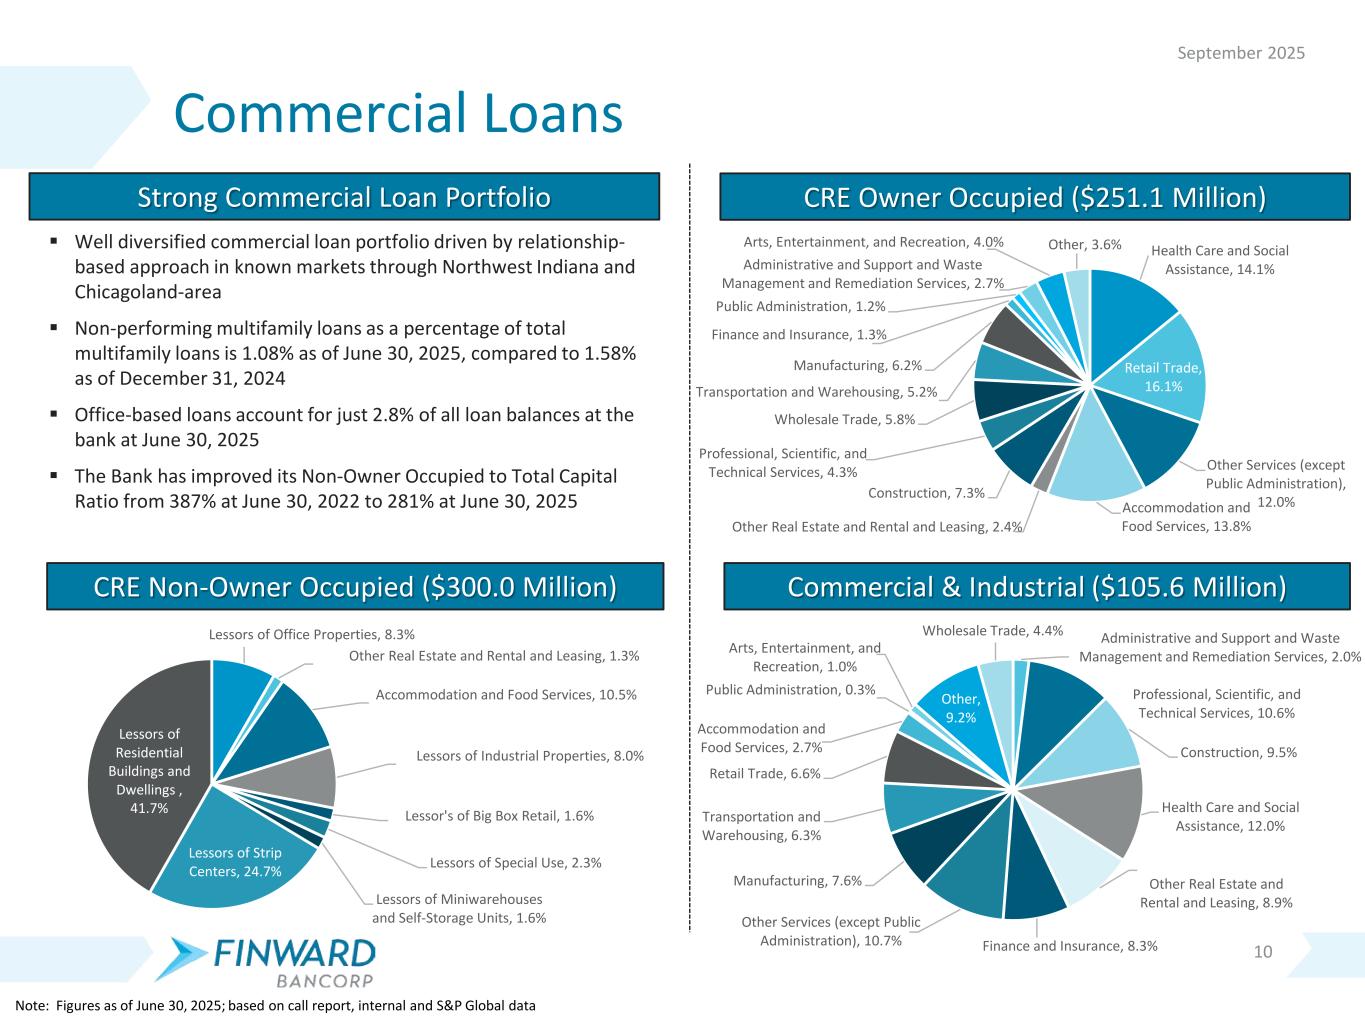
10 Commercial Loans September 2025 CRE Non-Owner Occupied ($300.0 Million) CRE Owner Occupied ($251.1 Million) Commercial & Industrial ($105.6 Million) Strong Commercial Loan Portfolio Well diversified commercial loan portfolio driven by relationship- based approach in known markets through Northwest Indiana and Chicagoland-area Non-performing multifamily loans as a percentage of total multifamily loans is 1.08% as of June 30, 2025, compared to 1.58% as of December 31, 2024 Office-based loans account for just 2.8% of all loan balances at the bank at June 30, 2025 The Bank has improved its Non-Owner Occupied to Total Capital Ratio from 387% at June 30, 2022 to 281% at June 30, 2025 Note: Figures as of June 30, 2025; based on call report, internal and S&P Global data Health Care and Social Assistance, 14.1% Retail Trade, 16.1% Other Services (except Public Administration), 12.0%Accommodation and Food Services, 13.8%Other Real Estate and Rental and Leasing, 2.4% Construction, 7.3% Professional, Scientific, and Technical Services, 4.3% Wholesale Trade, 5.8% Transportation and Warehousing, 5.2% Manufacturing, 6.2% Finance and Insurance, 1.3% Public Administration, 1.2% Administrative and Support and Waste Management and Remediation Services, 2.7% Arts, Entertainment, and Recreation, 4.0% Other, 3.6% Lessors of Office Properties, 8.3% Other Real Estate and Rental and Leasing, 1.3% Accommodation and Food Services, 10.5% Lessors of Industrial Properties, 8.0% Lessor's of Big Box Retail, 1.6% Lessors of Special Use, 2.3% Lessors of Miniwarehouses and Self-Storage Units, 1.6% Lessors of Strip Centers, 24.7% Lessors of Residential Buildings and Dwellings , 41.7% Administrative and Support and Waste Management and Remediation Services, 2.0% Professional, Scientific, and Technical Services, 10.6% Construction, 9.5% Health Care and Social Assistance, 12.0% Other Real Estate and Rental and Leasing, 8.9% Finance and Insurance, 8.3% Other Services (except Public Administration), 10.7% Manufacturing, 7.6% Transportation and Warehousing, 6.3% Retail Trade, 6.6% Accommodation and Food Services, 2.7% Public Administration, 0.3% Arts, Entertainment, and Recreation, 1.0% Other, 9.2% Wholesale Trade, 4.4%
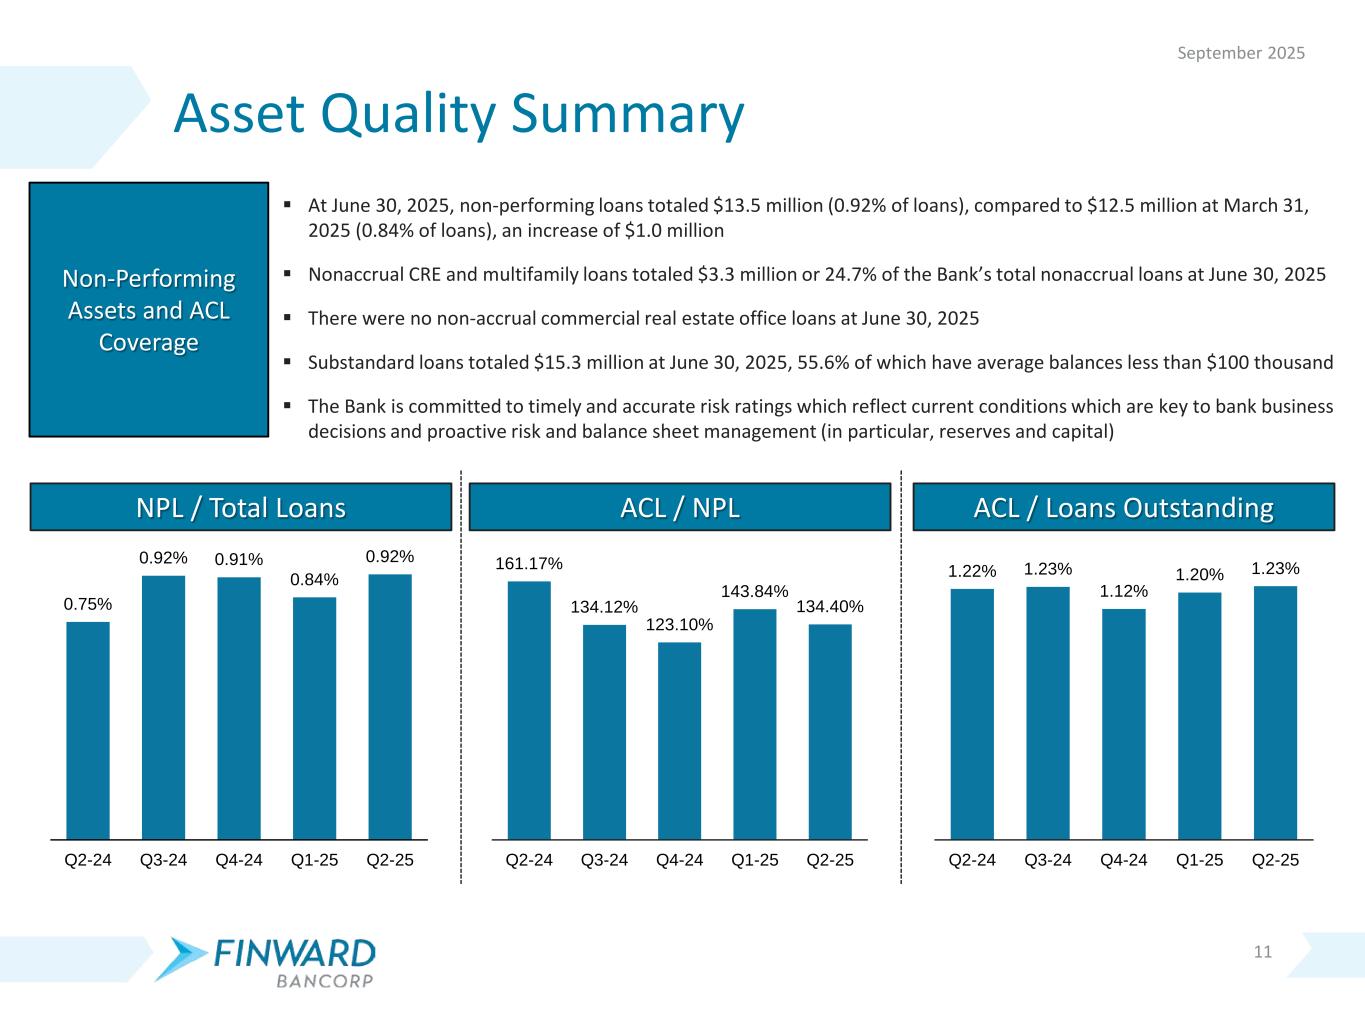
11 Asset Quality Summary Non-Performing Assets and ACL Coverage At June 30, 2025, non-performing loans totaled $13.5 million (0.92% of loans), compared to $12.5 million at March 31, 2025 (0.84% of loans), an increase of $1.0 million Nonaccrual CRE and multifamily loans totaled $3.3 million or 24.7% of the Bank’s total nonaccrual loans at June 30, 2025 There were no non-accrual commercial real estate office loans at June 30, 2025 Substandard loans totaled $15.3 million at June 30, 2025, 55.6% of which have average balances less than $100 thousand The Bank is committed to timely and accurate risk ratings which reflect current conditions which are key to bank business decisions and proactive risk and balance sheet management (in particular, reserves and capital) September 2025 NPL / Total Loans ACL / NPL ACL / Loans Outstanding 0.75% 0.92% 0.91% 0.84% 0.92% Q2-24 Q3-24 Q4-24 Q1-25 Q2-25 161.17% 134.12% 123.10% 143.84% 134.40% Q2-24 Q3-24 Q4-24 Q1-25 Q2-25 1.22% 1.23% 1.12% 1.20% 1.23% Q2-24 Q3-24 Q4-24 Q1-25 Q2-25
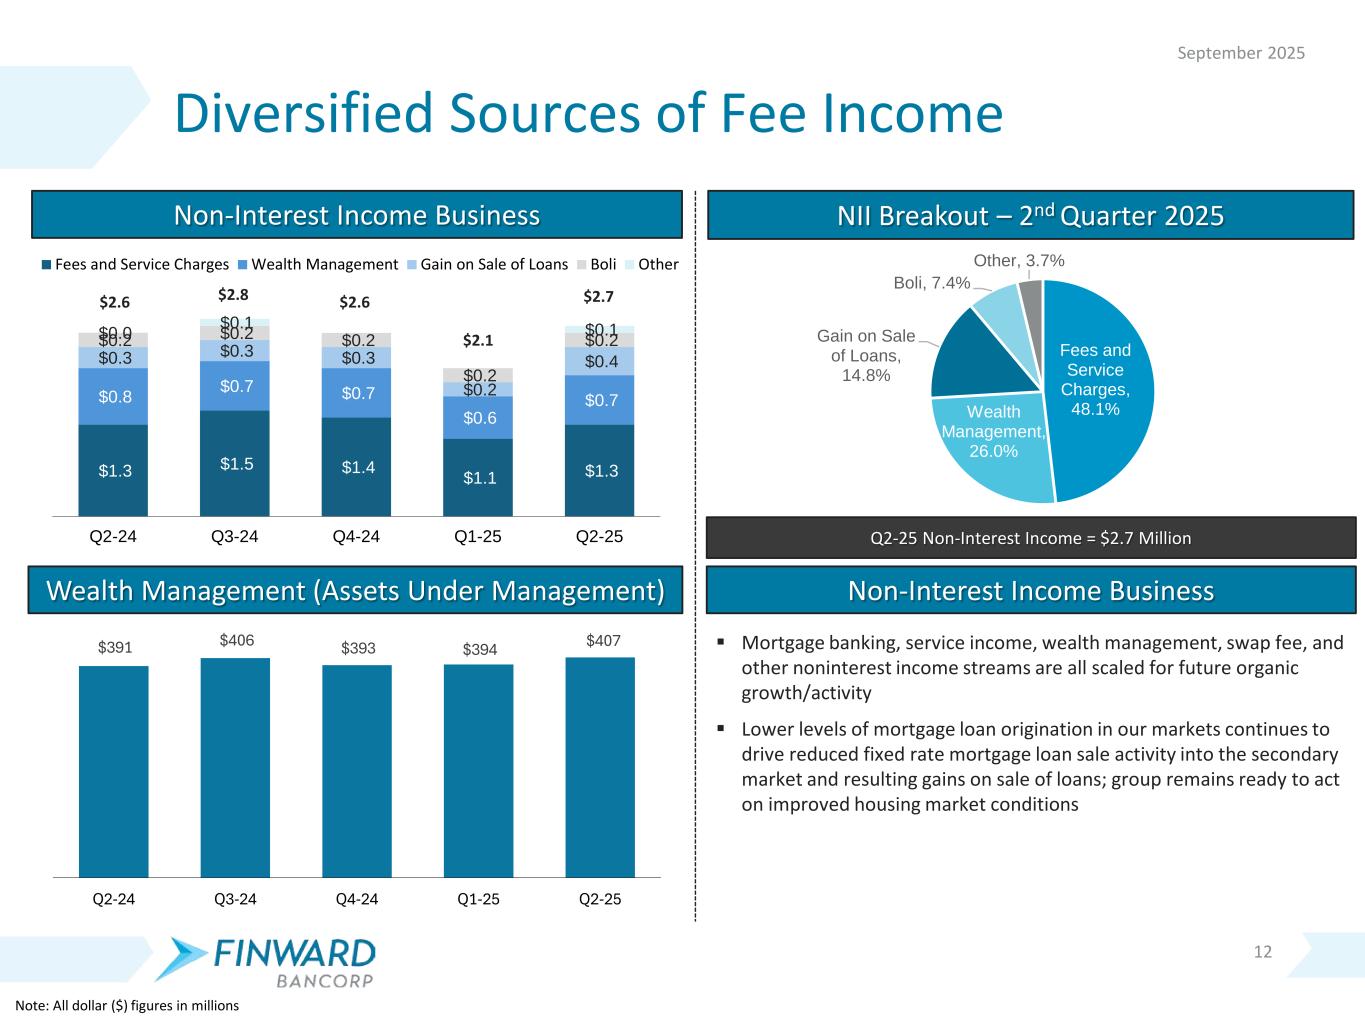
$1.3 $1.5 $1.4 $1.1 $1.3 $0.8 $0.7 $0.7 $0.6 $0.7 $0.3 $0.3 $0.3 $0.2 $0.4 $0.2 $0.2 $0.2 $0.2 $0.2 $0.0 $0.1 $0.1 Q2-24 Q3-24 Q4-24 Q1-25 Q2-25 Fees and Service Charges Wealth Management Gain on Sale of Loans Boli Other 12 Diversified Sources of Fee Income September 2025 Wealth Management (Assets Under Management) Non-Interest Income Business Non-Interest Income Business NII Breakout – 2nd Quarter 2025 Note: All dollar ($) figures in millions Mortgage banking, service income, wealth management, swap fee, and other noninterest income streams are all scaled for future organic growth/activity Lower levels of mortgage loan origination in our markets continues to drive reduced fixed rate mortgage loan sale activity into the secondary market and resulting gains on sale of loans; group remains ready to act on improved housing market conditions Q2-25 Non-Interest Income = $2.7 Million $2.7$2.6 $2.8 $2.6 $2.1 $391 $406 $393 $394 $407 Q2-24 Q3-24 Q4-24 Q1-25 Q2-25 Fees and Service Charges, 48.1%Wealth Management, 26.0% Gain on Sale of Loans, 14.8% Boli, 7.4% Other, 3.7%
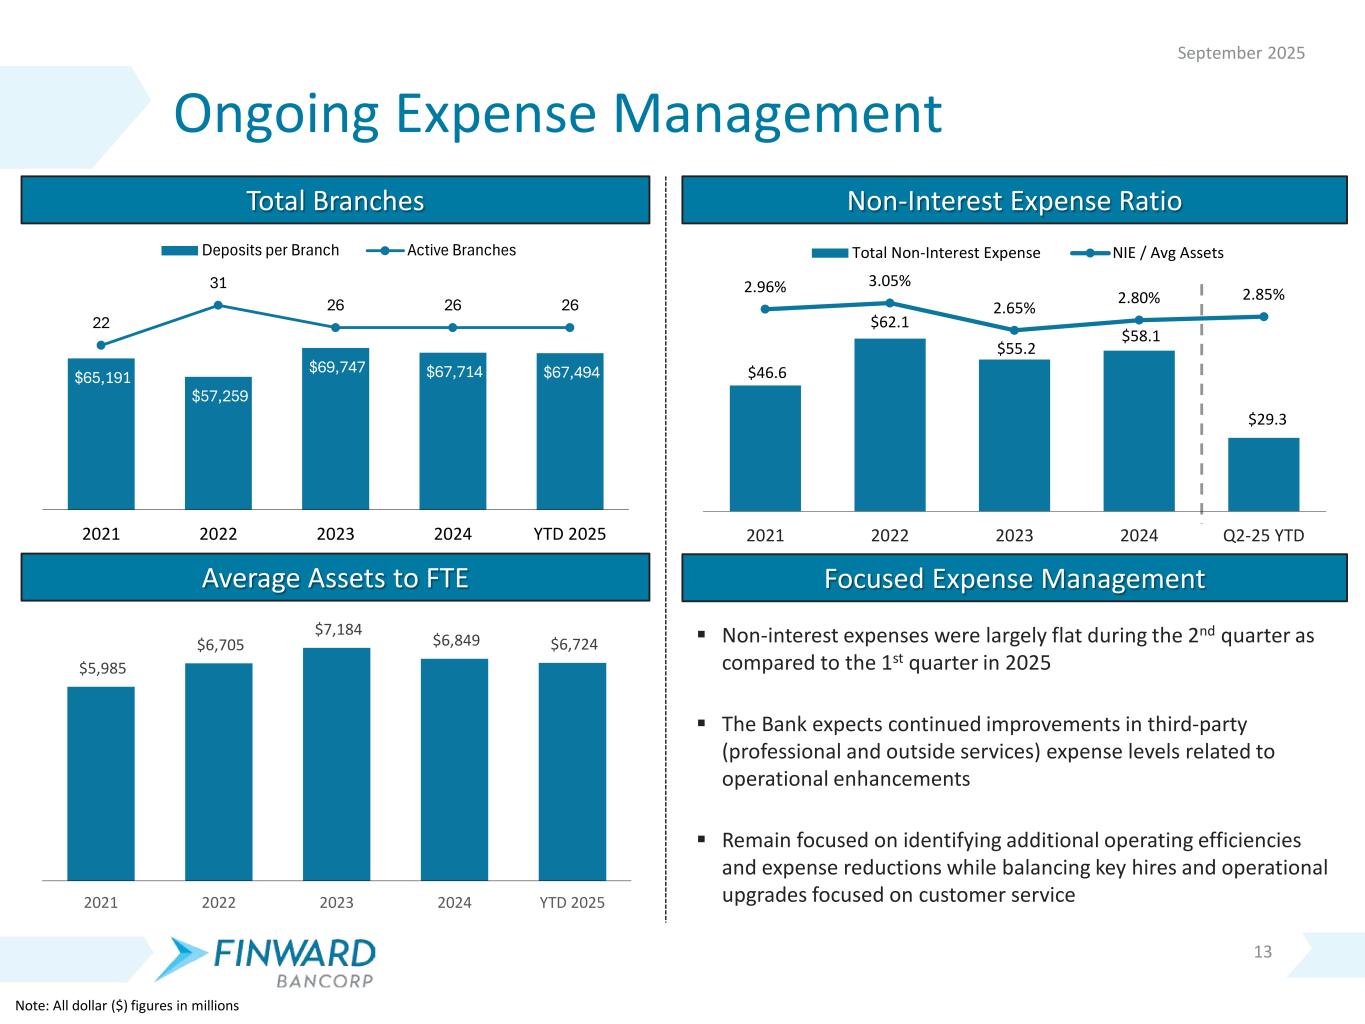
13 Ongoing Expense Management Non-interest expenses were largely flat during the 2nd quarter as compared to the 1st quarter in 2025 The Bank expects continued improvements in third-party (professional and outside services) expense levels related to operational enhancements Remain focused on identifying additional operating efficiencies and expense reductions while balancing key hires and operational upgrades focused on customer service September 2025 Average Assets to FTE Non-Interest Expense Ratio Focused Expense Management Total Branches Note: All dollar ($) figures in millions $46.6 $62.1 $55.2 $58.1 $29.3 2.96% 3.05% 2.65% 2.80% 2.85% 2021 2022 2023 2024 Q2-25 YTD Total Non-Interest Expense NIE / Avg Assets $65,191 $57,259 $69,747 $67,714 $67,494 22 31 26 26 26 2021 2022 2023 2024 YTD 2025 Deposits per Branch Active Branches $5,985 $6,705 $7,184 $6,849 $6,724 2021 2022 2023 2024 YTD 2025
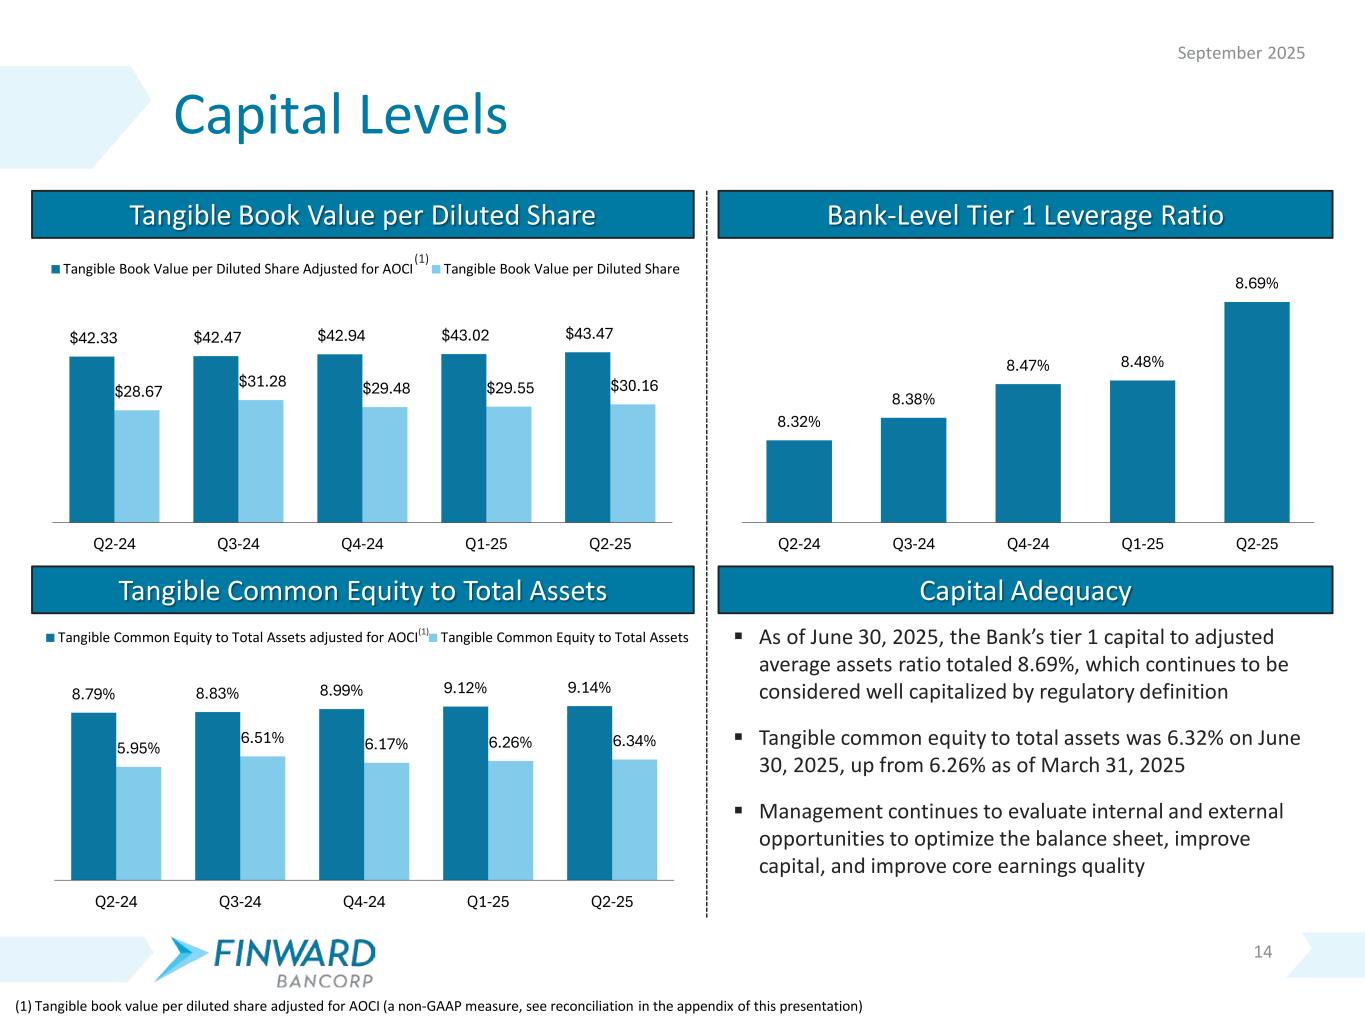
Capital Levels 14 September 2025 Tangible Common Equity to Total Assets Capital Adequacy Tangible Book Value per Diluted Share Bank-Level Tier 1 Leverage Ratio As of June 30, 2025, the Bank’s tier 1 capital to adjusted average assets ratio totaled 8.69%, which continues to be considered well capitalized by regulatory definition Tangible common equity to total assets was 6.32% on June 30, 2025, up from 6.26% as of March 31, 2025 Management continues to evaluate internal and external opportunities to optimize the balance sheet, improve capital, and improve core earnings quality (1) Tangible book value per diluted share adjusted for AOCI (a non-GAAP measure, see reconciliation in the appendix of this presentation) (1) (1) $42.33 $42.47 $42.94 $43.02 $43.47 $28.67 $31.28 $29.48 $29.55 $30.16 Q2-24 Q3-24 Q4-24 Q1-25 Q2-25 Tangible Book Value per Diluted Share Adjusted for AOCI Tangible Book Value per Diluted Share 8.32% 8.38% 8.47% 8.48% 8.69% Q2-24 Q3-24 Q4-24 Q1-25 Q2-25 8.79% 8.83% 8.99% 9.12% 9.14% 5.95% 6.51% 6.17% 6.26% 6.34% Q2-24 Q3-24 Q4-24 Q1-25 Q2-25 Tangible Common Equity to Total Assets adjusted for AOCI Tangible Common Equity to Total Assets
THANK YOU
APPENDIX
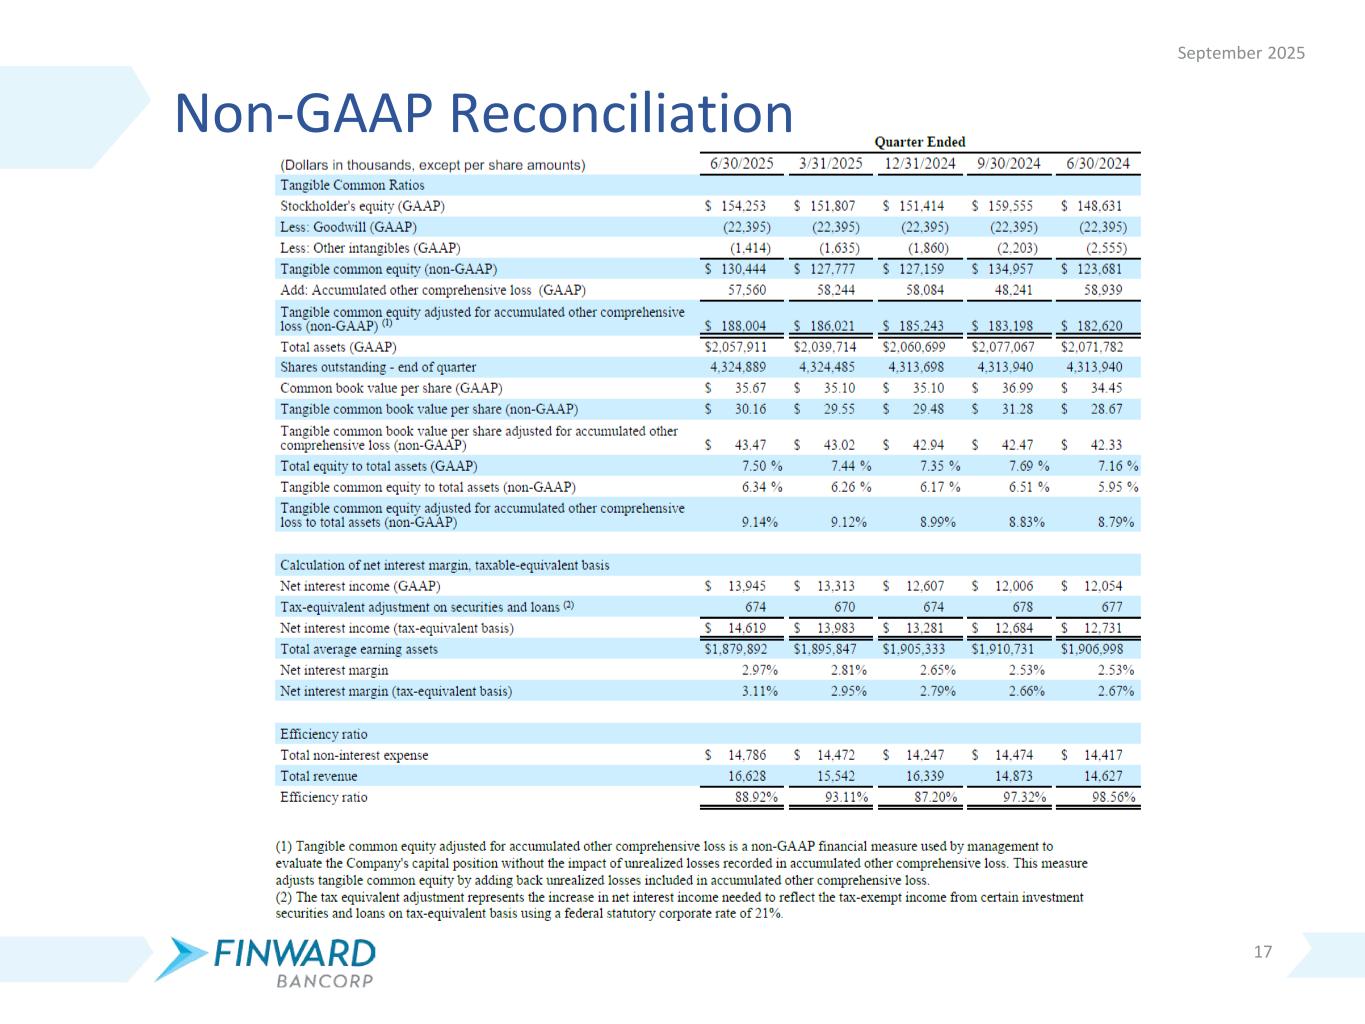
17 September 2025 Non-GAAP Reconciliation