

|
Sincerely,
|
|
 |
|
|
David
A. Bochnowski
|
|
|
Chairman
and Chief Executive
Officer
|

|
|
December 31,
|
December 31,
|
December 31,
|
December 31,
|
December 31,
|
December 31,
|
||||||||||||||||||
|
Fiscal Year Ended
|
2009
|
2008
|
2007
|
2006
|
2005
|
2004
|
||||||||||||||||||
|
Statement
of Income:
|
||||||||||||||||||||||||
|
Total
interest income
|
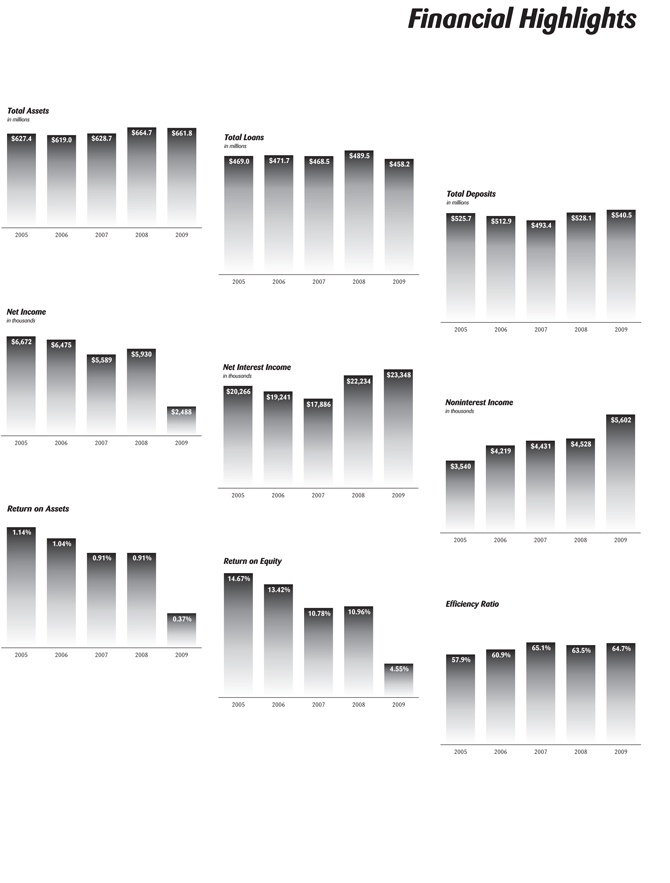
$ | 32,189 | $ | 35,167 | $ | 35,768 | $ | 34,979 | $ | 30,024 | $ | 26,614 | ||||||||||||
|
Total
interest expense
|
8,841 | 12,933 | 17,882 | 15,738 | 9,758 | 6,858 | ||||||||||||||||||
|
Net
interest income
|
23,348 | 22,234 | 17,886 | 19,241 | 20,266 | 19,756 | ||||||||||||||||||
|
Provision
for loan losses
|
8,540 | 2,388 | 552 | 15 | 245 | 385 | ||||||||||||||||||
|
Net
interest income after provision for loan losses
|
14,808 | 19,846 | 17,334 | 19,226 | 20,021 | 19,371 | ||||||||||||||||||
|
Noninterest
income
|
5,602 | 4,528 | 4,431 | 4,219 | 3,540 | 3,312 | ||||||||||||||||||
|
Noninterest
expense
|
18,735 | 16,999 | 14,525 | 14,296 | 13,771 | 13,174 | ||||||||||||||||||
|
Net
noninterest expense
|
13,133 | 12,471 | 10,094 | 10,077 | 10,231 | 9,862 | ||||||||||||||||||
|
Income
tax expenses/(benefit)
|
(813 | ) | 1,445 | 1,651 | 2,674 | 3,118 | 3,219 | |||||||||||||||||
|
Net
income
|
$ | 2,488 | $ | 5,930 | $ | 5,589 | $ | 6,475 | $ | 6,672 | $ | 6,290 | ||||||||||||
|
Basic
earnings per common share
|
$ | 0.88 | $ | 2.11 | $ | 1.99 | $ | 2.32 | $ | 2.40 | $ | 2.28 | ||||||||||||
|
Diluted
earnings per common share
|
$ | 0.88 | $ | 2.10 | $ | 1.98 | $ | 2.30 | $ | 2.37 | $ | 2.24 | ||||||||||||
|
Cash
dividends declared per common share
|
$ | 1.21 | $ | 1.44 | $ | 1.44 | $ | 1.40 | $ | 1.32 | $ | 1.24 | ||||||||||||
|
December
31,
|
December
31,
|
December
31,
|
December
31,
|
December
31,
|
December
31,
|
|||||||||||||||||||
|
2009
|
2008
|
2007
|
2006
|
2005
|
2004
|
|||||||||||||||||||
|
Balance
Sheet:
|
||||||||||||||||||||||||
|
Total
assets
|
$ | 661,806 | $ | 664,732 | $ | 628,718 | $ | 618,982 | $ | 627,439 | $ | 557,393 | ||||||||||||
|
Loans
receivable
|
458,245 | 489,509 | 468,459 | 471,716 | 469,043 | 433,790 | ||||||||||||||||||
|
Investment
securities
|
144,333 | 126,722 | 114,644 | 99,012 | 90,093 | 79,979 | ||||||||||||||||||
|
Deposits
|
540,527 | 528,148 | 493,384 | 512,931 | 525,731 | 451,573 | ||||||||||||||||||
|
Borrowed
funds
|
63,022 | 74,795 | 76,930 | 51,501 | 51,152 | 57,201 | ||||||||||||||||||
|
Total
stockholders’ equity
|
53,078 | 52,773 | 52,733 | 50,010 | 46,433 | 44,097 | ||||||||||||||||||
|
|
December
31,
|
December
31,
|
December
31,
|
December
31,
|
December
31,
|
December
31,
|
||||||||||||||||||
|
Fiscal
Year Ended
|
2009
|
2008
|
2007
|
2006
|
2005
|
2004
|
||||||||||||||||||
|
Interest
Rate Spread During Period:
|
||||||||||||||||||||||||
|
Average
effective yield on loans and investment securities
|
5.16 | % | 5.78 | % | 6.21 | % | 6.02 | % | 5.50 | % | 5.31 | % | ||||||||||||
|
Average
effective cost of deposits and borrowings
|
1.45 | % | 2.19 | % | 3.18 | % | 2.77 | % | 1.82 | % | 1.40 | % | ||||||||||||
|
Interest
rate spread
|
3.71 | % | 3.59 | % | 3.03 | % | 3.25 | % | 3.68 | % | 3.91 | % | ||||||||||||
|
Net
interest margin
|
3.74 | % | 3.65 | % | 3.10 | % | 3.31 | % | 3.71 | % | 3.94 | % | ||||||||||||
|
Return
on average assets
|
0.37 | % | 0.91 | % | 0.91 | % | 1.04 | % | 1.14 | % | 1.17 | % | ||||||||||||
|
Return
on average equity
|
4.55 | % | 10.96 | % | 10.78 | % | 13.42 | % | 14.67 | % | 14.64 | % | ||||||||||||
|
December
31,
|
December
31,
|
December
31,
|
December
31,
|
December
31,
|
December
31,
|
|||||||||||||||||||
|
2009
|
2008
|
2007
|
2006
|
2005
|
2004
|
|||||||||||||||||||
|
Total
capital to risk-weighted assets
|
11.5 | % | 12.0 | % | 12.0 | % | 12.0 | % | 11.6 | % | 12.2 | % | ||||||||||||
|
Tier
1 capital to risk-weighted assets
|
10.3 | % | 10.8 | % | 11.0 | % | 11.1 | % | 10.7 | % | 11.2 | % | ||||||||||||
|
Tier
1 capital to adjusted average assets
|
7.8 | % | 8.2 | % | 8.3 | % | 8.0 | % | 7.9 | % | 8.0 | % | ||||||||||||
|
Allowance
for loan losses to total loans
|
1.33 | % | 1.19 | % | 0.98 | % | 0.90 | % | 0.89 | % | 0.90 | % | ||||||||||||
|
Allowance
for loan losses to non-performing loans
|
32.93 | % | 46.97 | % | 53.16 | % | 153.95 | % | 198.00 | % | 371.00 | % | ||||||||||||
|
Non-performing
loans to total loans
|
4.05 | % | 2.54 | % | 1.84 | % | 0.58 | % | 0.45 | % | 0.24 | % | ||||||||||||
|
Total
loan accounts
|
4,846 | 5,193 | 5,268 | 5,392 | 5,422 | 5,370 | ||||||||||||||||||
|
Total
deposit accounts
|
32,616 | 33,692 | 30,760 | 32,435 | 33,963 | 32,866 | ||||||||||||||||||
|
Total
Banking Centers (all full service)
|
11 | 10 | 9 | 8 | 8 | 8 | ||||||||||||||||||
|
December 31,
|
December 31,
|
December 31,
|
December 31,
|
|||||||||||
|
2003
|
2002
|
2001
|
2000
|
|||||||||||
| $ | 26,357 | $ | 27,781 | $ | 28,425 | $ | 28,077 | |||||||
| 7,521 | 10,107 | 13,222 | 13,386 | |||||||||||
| 18,836 | 17,674 | 15,203 | 14,691 | |||||||||||
| 420 | 720 | 230 | 175 | |||||||||||
| 18,416 | 16,954 | 14,973 | 14,516 | |||||||||||
| 2,968 | 2,675 | 2,402 | 1,995 | |||||||||||
| 12,037 | 10,859 | 9,911 | 9,449 | |||||||||||
| 9,069 | 8,184 | 7,509 | 7,454 | |||||||||||
| 3,411 | 3,277 | 2,754 | 2,691 | |||||||||||
| $ | 5,936 | $ | 5,493 | $ | 4,710 | $ | 4,371 | |||||||
| $ | 2.16 | $ | 2.01 | $ | 1.73 | $ | 1.61 | |||||||
| $ | 2.13 | $ | 1.99 | $ | 1.71 | $ | 1.60 | |||||||
| $ | 1.20 | $ | 1.12 | $ | 1.04 | $ | 0.96 | |||||||
|
December
31,
|
December
31,
|
December
31,
|
December
31,
|
|||||||||||
|
2003
|
2002
|
2001
|
2000
|
|||||||||||
| $ | 508,775 | $ | 488,002 | $ | 440,710 | $ | 392,313 | |||||||
| 409,808 | 380,428 | 342,642 | 326,207 | |||||||||||
| 63,733 | 56,571 | 67,260 | 38,128 | |||||||||||
| 421,640 | 406,673 | 355,215 | 324,310 | |||||||||||
| 40,895 | 36,065 | 44,989 | 30,599 | |||||||||||
| 41,554 | 39,148 | 35,882 | 33,529 | |||||||||||
|
December
31,
|
December
31,
|
December
31,
|
December
31,
|
|||||||||||
|
2003
|
2002
|
2001
|
2000
|
|||||||||||
| 5.65 | % | 6.26 | % | 7.29 | % | 7.88 | % | |||||||
| 1.67 | % | 2.38 | % | 3.55 | % | 3.95 | % | |||||||
| 3.98 | % | 3.88 | % | 3.74 | % | 3.93 | % | |||||||
| 4.04 | % | 3.99 | % | 3.90 | % | 4.12 | % | |||||||
| 1.20 | % | 1.18 | % | 1.15 | % | 1.17 | % | |||||||
| 14.65 | % | 14.58 | % | 13.49 | % | 13.30 | % | |||||||
|
December
31,
|
December
31,
|
December
31,
|
December
31,
|
|||||||||||
|
2003
|
2002
|
2001
|
2000
|
|||||||||||
| 12.5 | % | 13.1 | % | 13.6 | % | 13.6 | % | |||||||
| 11.5 | % | 11.9 | % | 12.5 | % | 12.3 | % | |||||||
| 8.0 | % | 7.6 | % | 8.3 | % | 8.6 | % | |||||||
| 0.92 | % | 0.96 | % | 0.92 | % | 1.02 | % | |||||||
| 220.31 | % | 152.43 | % | 108.64 | % | 183.54 | % | |||||||
| 0.42 | % | 0.63 | % | 0.85 | % | 0.55 | % | |||||||
| 5,213 | 5,049 | 4,964 | 4,762 | |||||||||||
| 32,502 | 31,385 | 30,433 | 28,906 | |||||||||||
| 8 | 8 | 8 | 8 | |||||||||||
|
·
|
We
expect to face increased regulation of our industry. Compliance with such
regulation may increase our costs and limit our ability to pursue business
opportunities.
|
|
·
|
Our
ability to assess the creditworthiness of our customers may be impaired if
the models and approaches we use to select, manage and underwrite our
customers become less predictive of future
behaviors.
|
|
·
|
The
process we use to estimate losses inherent in our credit exposure requires
difficult, subjective and complex judgments, including forecasts of
economic conditions and how these economic predictions might impair the
ability of our borrowers to repay their loans, which may no longer be
capable of accurate estimation which may, in turn, impact the reliability
of the process.
|
|
·
|
Our
ability to borrow from other financial institutions on favorable terms or
at all could be adversely affected by further disruptions in the capital
markets or other events, including actions by rating agencies and
deteriorating investor
expectations.
|
|
·
|
Competition
in our industry could intensify as a result of the increasing
consolidation of financial services companies in connection with current
market conditions.
|
|
·
|
We
may be required to pay significantly higher deposit insurance premiums
because market developments have significantly depleted the insurance fund
of the Federal Deposit Insurance Corporation and reduced the ratio of
reserves to insured deposits.
|
|
Required for
|
To Be Well
|
|||||||||||||||||||||||
|
At December 31, 2009
|
Actual
|
Adequate
Capital
|
Capitalized
|
|||||||||||||||||||||
|
Amount
|
Ratio
|
Amount
|
Ratio
|
Amount
|
Ratio
|
|||||||||||||||||||
|
Total
capital to risk-weighted assets
|
$ | 58,689 | 11.5 | % | $ | 40,770 | 8.0 | % | $ | 50,963 | 10.0 | % | ||||||||||||
|
Tier
1 capital to risk-weighted assets
|
$ | 52,574 | 10.3 | % | $ | 20,385 | 4.0 | % | $ | 30,578 | 6.0 | % | ||||||||||||
|
Tier
1 capital to adjusted average assets
|
$ | 52,574 | 7.8 | % | $ | 20,112 | 3.0 | % | $ | 33,520 | 5.0 | % | ||||||||||||

 |
|
Plante
& Moran, PLLC
|

 |
|
Crowe
Horwath LLP
|
|
|
December 31,
|
|||||||
|
(Dollars in thousands)
|
2009
|
2008
|
||||||
|
ASSETS
|
||||||||
|
Cash
and non-interest bearing balances in financial
institutions
|
$ | 8,705 | $ | 10,005 | ||||
|
Interest
bearing balances in financial institutions
|
447 | 1,291 | ||||||
|
Federal
funds sold
|
4,070 | – | ||||||
|
Total
cash and cash equivalents
|
13,222 | 11,296 | ||||||
|
Securities
available-for-sale
|
124,776 | 108,207 | ||||||
|
Securities
held-to-maturity
|
19,557 | 18,515 | ||||||
|
Loans
held for sale
|
1,025 | – | ||||||
|
Loans
receivable
|
458,245 | 489,509 | ||||||
|
Less:
allowance for loan losses
|
(6,114 | ) | (5,830 | ) | ||||
|
Net
loans receivable
|
452,131 | 483,679 | ||||||
|
Federal
Home Loan Bank stock
|
3,650 | 3,650 | ||||||
|
Accrued
interest receivable
|
2,878 | 3,160 | ||||||
|
Premises
and equipment
|
19,590 | 19,083 | ||||||
|
Foreclosed
real estate
|
3,747 | 527 | ||||||
|
Cash
value of bank owned life insurance
|
12,049 | 11,641 | ||||||
|
Prepaid
FDIC insurance premium
|
3,282 | – | ||||||
|
Other
assets
|
5,899 | 4,974 | ||||||
|
Total
assets
|
$ | 661,806 | $ | 664,732 | ||||
|
LIABILITIES
AND STOCKHOLDERS’ EQUITY
|
||||||||
|
Deposits:
|
||||||||
|
Non-interest
bearing
|
$ | 42,390 | $ | 43,367 | ||||
|
Interest
bearing
|
498,137 | 484,781 | ||||||
|
Total
|
540,527 | 528,148 | ||||||
|
Repurchase
agreements
|
15,893 | 25,773 | ||||||
|
Borrowed
funds
|
47,129 | 49,022 | ||||||
|
Accrued
expenses and other liabilities
|
5,179 | 9,016 | ||||||
|
Total
liabilities
|
608,728 | 611,959 | ||||||
|
Stockholders’
Equity:
|
||||||||
|
Preferred
stock, no par or stated value;
|
||||||||
|
10,000,000
shares authorized, none outstanding
|
– | – | ||||||
|
Common
stock, no par or stated value; 10,000,000 shares
authorized;
|
||||||||
|
shares
issued: December 31, 2009 - 2,889,452
|
||||||||
|
December
31, 2008 - 2,887,452
|
||||||||
|
shares
outstanding: December 31, 2009 - 2,818,578
|
||||||||
|
December 31, 2008 - 2,809,075
|
361 | 361 | ||||||
|
Additional
paid-in capital
|
5,104 | 5,064 | ||||||
|
Accumulated
other comprehensive income/(loss)
|
(170 | ) | (1,289 | ) | ||||
|
Retained
earnings
|
49,312 | 50,365 | ||||||
|
Treasury
stock, common shares at cost: December 31, 2009 - 70,874
|
||||||||
|
December
31, 2008 - 78,377
|
(1,529 | ) | (1,728 | ) | ||||
|
Total
stockholders’ equity
|
53,078 | 52,773 | ||||||
|
Total
liabilities and stockholders’ equity
|
$ | 661,806 | $ | 664,732 | ||||
|
|
Year ended December 31,
|
|||||||
| (Dollars in thousands, except per share data) |
2009
|
2008
|
||||||
|
Interest
income:
|
||||||||
|
Loans
receivable
|
||||||||
|
Real
estate loans
|
$ | 22,046 | $ | 25,274 | ||||
|
Commercial
loans
|
3,822 | 3,843 | ||||||
|
Consumer
loans
|
121 | 152 | ||||||
|
Total
loan interest
|
25,989 | 29,269 | ||||||
|
Securities
|
6,185 | 5,833 | ||||||
|
Other
interest earning assets
|
15 | 65 | ||||||
|
Total
interest income
|
32,189 | 35,167 | ||||||
|
Interest
expense:
|
||||||||
|
Deposits
|
7,083 | 10,648 | ||||||
|
Repurchase
agreements
|
290 | 432 | ||||||
|
Borrowed
funds
|
1,468 | 1,853 | ||||||
|
Total
interest expense
|
8,841 | 12,933 | ||||||
|
Net
interest income
|
23,348 | 22,234 | ||||||
|
Provision
for loan losses
|
8,540 | 2,388 | ||||||
|
Net
interest income after provision for loan losses
|
14,808 | 19,846 | ||||||
|
Noninterest
income:
|
||||||||
|
Fees
and service charges
|
2,661 | 2,898 | ||||||
|
Gain
on sale of loans, net
|
1,139 | 108 | ||||||
|
Wealth
management operations
|
933 | 814 | ||||||
|
Gain
on sales of securities, net
|
736 | 210 | ||||||
|
Increase
in cash value of bank owned life insurance
|
407 | 413 | ||||||
|
Loss
on sale of foreclosed real estate
|
(161 | ) | (52 | ) | ||||
|
Other-than-temporary
credit loss impairment of debt securities
|
(523 | ) | – | |||||
|
Net
credit portion of gain recognized in other comprehensive
income
|
387 | – | ||||||
|
Other
|
23 | 137 | ||||||
|
Total
noninterest income
|
5,602 | 4,528 | ||||||
|
Noninterest
expense:
|
||||||||
|
Compensation
and benefits
|
9,346 | 8,822 | ||||||
|
Occupancy
and equipment
|
2,893 | 2,834 | ||||||
|
Federal
deposit insurance premiums
|
1,227 | 348 | ||||||
|
Data
processing
|
871 | 852 | ||||||
|
Marketing
|
469 | 405 | ||||||
|
Statement
and check processing
|
325 | 378 | ||||||
|
Professional
services
|
261 | 329 | ||||||
|
Other
|
3,343 | 3,031 | ||||||
|
Total
noninterest expense
|
18,735 | 16,999 | ||||||
|
Income
before income tax expenses
|
1,675 | 7,375 | ||||||
|
Income
tax (benefits) expenses
|
(813 | ) | 1,445 | |||||
|
Net
income
|
$ | 2,488 | $ | 5,930 | ||||
|
Earnings
per common share:
|
||||||||
|
Basic
|
$ | 0.88 | $ | 2.11 | ||||
|
Diluted
|
$ | 0.88 | $ | 2.10 | ||||
|
Dividends
declared per common share
|
$ | 1.21 | $ | 1.44 | ||||
|
Accumulated
|
||||||||||||||||||||||||
|
Additional
|
Other
|
|||||||||||||||||||||||
|
Common
|
Paid-in
|
Comprehensive
|
Retained
|
Treasury
|
Total
|
|||||||||||||||||||
|
(Dollars
in thousands, except per share data)
|
Stock
|
Capital
|
Income (Loss)
|
Earnings
|
Stock
|
Equity
|
||||||||||||||||||
|
Balance
at December 31, 2007
|
360 | 4,895 | 563 | 48,500 | (1,585 | ) | 52,733 | |||||||||||||||||
|
Comprehensive
income:
|
||||||||||||||||||||||||
|
Net
income
|
– | – | – | 5,930 | – | 5,930 | ||||||||||||||||||
|
Net
unrealized gain/(loss) on securities available-for-sale, net of
reclassification and tax effects
|
– | – | (1,841 | ) | – | – | (1,841 | ) | ||||||||||||||||
|
Change
in unrecognized gain on post retirement benefit, net of reclassification
and tax effects
|
– | – | (11 | ) | – | – | (11 | ) | ||||||||||||||||
|
Comprehensive
income
|
– | – | – | – | – | 4,078 | ||||||||||||||||||
|
Issuance
of 5,355 shares of common stock at $20.50 - $28.00 per share, under
stock-based compensation plans, including related tax
effects
|
1 | 106 | – | – | – | 107 | ||||||||||||||||||
|
Stock-based
compensation expense
|
– | 57 | – | – | – | 57 | ||||||||||||||||||
|
Purchase
of treasury stock
|
– | – | – | – | (226 | ) | (226 | ) | ||||||||||||||||
|
Sale
of treasury stock
|
– | 6 | – | – | 83 | 89 | ||||||||||||||||||
|
Adjustments
to retained earnings for split-dollar life insurance
arrangements
|
– | – | – | (20 | ) | – | (20 | ) | ||||||||||||||||
|
Cash
dividends, $1.44 per share
|
– | – | – | (4,045 | ) | – | (4,045 | ) | ||||||||||||||||
|
Balance
at December 31, 2008
|
$ | 361 | $ | 5,064 | $ | (1,289 | ) | $ | 50,365 | $ | (1,728 | ) | $ | 52,773 | ||||||||||
|
Comprehensive
income:
|
||||||||||||||||||||||||
|
Net
income
|
– | – | – | 2,488 | – | 2,488 | ||||||||||||||||||
|
Net
unrealized gain/(loss) on securities available-for-sale, net of
reclassification and tax effects
|
– | – | 1,128 | – | – | 1,128 | ||||||||||||||||||
|
Change
in unrecognized gain on post retirement benefit, net of reclassification
and tax effects
|
– | – | (9 | ) | – | – | (9 | ) | ||||||||||||||||
|
Comprehensive
income
|
– | – | – | – | – | 3,607 | ||||||||||||||||||
|
Issuance
of 9,503 shares of common stock at $18.50 - $20.50 per share, under
stock-based compensation plans, including related tax
effects
|
– | 6 | – | – | – | 6 | ||||||||||||||||||
|
Stock-based
compensation expense
|
– | 40 | – | – | – | 40 | ||||||||||||||||||
|
Sale
of treasury stock
|
– | (6 | ) | – | (52 | ) | 199 | 141 | ||||||||||||||||
|
Adjustments
to retained earnings for split-dollar life insurance
arrangements
|
– | – | – | (84 | ) | – | (84 | ) | ||||||||||||||||
|
Cash
dividends, $1.21 per share
|
– | – | – | (3,405 | ) | – | (3,405 | ) | ||||||||||||||||
|
Balance
at December 31, 2009
|
$ | 361 | $ | 5,104 | $ | (170 | ) | $ | 49,312 | $ | (1,529 | ) | $ | 53,078 | ||||||||||
|
Year Ended December 31,
|
||||||||
|
(Dollars in thousands)
|
2009
|
2008
|
||||||
|
CASH
FLOWS FROM OPERATING ACTIVITIES:
|
||||||||
|
Net
income
|
$ | 2,488 | $ | 5,930 | ||||
|
Adjustments
to reconcile net income to net cash provided by operating
activities:
|
||||||||
|
Origination
of loans for sale
|
(49,670 | ) | (4,225 | ) | ||||
|
Sale
of loans originated for sale
|
49,449 | 4,333 | ||||||
|
Depreciation
and amortization, net of accretion
|
1,457 | 1,330 | ||||||
|
Amortization
of mortgage servicing rights
|
144 | 98 | ||||||
|
Amortization
of investment in real estate limited partnerships
|
26 | 32 | ||||||
|
Equity
in loss of investments in real estate limited partnership, net of interest
received
|
151 | 41 | ||||||
|
Stock
based compensation expense
|
40 | 57 | ||||||
|
Net
gains on sales and calls of securities
|
(736 | ) | (210 | ) | ||||
|
Net
gains on sale of loans
|
(1,139 | ) | (108 | ) | ||||
|
Net
losses due to other-than-temporary impairment of
securities
|
136 | – | ||||||
|
Net
losses on foreclosed real estate
|
161 | 52 | ||||||
|
Provision
for loan losses
|
8,540 | 2,388 | ||||||
|
Net
change in:
|
||||||||
|
Interest
receivable
|
282 | 134 | ||||||
|
Other
assets
|
(4,964 | ) | (613 | ) | ||||
|
Cash
value of bank owned life insurance
|
(408 | ) | (412 | ) | ||||
|
Accrued
expenses and other liabilities
|
(4,710 | ) | 3,318 | |||||
|
Total
adjustments
|
(1,241 | ) | 6,215 | |||||
|
Net
cash – operating
activities
|
1,247 | 12,145 | ||||||
|
CASH
FLOWS FROM INVESTING ACTIVITIES:
|
||||||||
|
Proceeds
from maturities and paydowns of securities
available-for-sale
|
21,178 | 26,577 | ||||||
|
Proceeds
from sales of securities available-for-sale
|
29,933 | 11,203 | ||||||
|
Purchase
of securities available-for-sale
|
(64,566 | ) | (52,191 | ) | ||||
|
Purchase
of securities held-to-maturity
|
(3,860 | ) | (2,171 | ) | ||||
|
Proceeds
from maturities and paydowns of securities
held-to-maturity
|
2,790 | 1,991 | ||||||
|
Proceeds
from sale of loans transferred to held-for-sale
|
10,651 | – | ||||||
|
Loan
participations purchased
|
– | (957 | ) | |||||
|
Net
change in loans receivable
|
8,744 | (22,094 | ) | |||||
|
Purchase
of Federal Home Loan Bank Stock
|
– | (100 | ) | |||||
|
Purchase
of premises and equipment, net
|
(1,929 | ) | (4,144 | ) | ||||
|
Proceeds
from sale of foreclosed real estate
|
390 | 372 | ||||||
|
Net
cash – investing
activities
|
3,331 | (41,514 | ) | |||||
|
CASH
FLOWS FROM FINANCING ACTIVITIES:
|
||||||||
|
Change
in deposits
|
12,379 | 34,764 | ||||||
|
Proceeds
from FHLB advances
|
8,000 | 36,000 | ||||||
|
Repayment
of FHLB advances
|
(16,000 | ) | (32,000 | ) | ||||
|
Change
in other borrowed funds
|
(3,773 | ) | (6,135 | ) | ||||
|
Tax
effect of nonqualified stock option exercise
|
– | 6 | ||||||
|
Proceeds
from issuance of common stock
|
6 | 107 | ||||||
|
Proceeds
from sale of treasury stock
|
141 | 83 | ||||||
|
Dividends
paid
|
(3,405 | ) | (4,045 | ) | ||||
|
Treasury
stock purchased
|
– | (226 | ) | |||||
|
Net
cash – financing
activities
|
(2,652 | ) | 28,554 | |||||
|
Net
change in cash and cash equivalents
|
1,926 | (815 | ) | |||||
|
Cash
and cash equivalents at beginning of period
|
11,296 | 12,111 | ||||||
|
Cash
and cash equivalents at end of period
|
$ | 13,222 | $ | 11,296 | ||||
|
SUPPLEMENTAL
CASH FLOW INFORMATION:
|
||||||||
|
Cash
paid during the period for:
|
||||||||
|
Interest
|
$ | 8,947 | $ | 12,916 | ||||
|
Income
taxes
|
$ | 990 | $ | 1,885 | ||||
|
SUPPLEMENTAL
NONCASH INFORMATION:
|
||||||||
|
Transfers
from loans to foreclosed real estate
|
$ | 3,763 | $ | 817 | ||||
|
Transfers
from loans to loans held for sale
|
$ | 10,497 | – | |||||
|
(Dollars in thousands)
|
||||||||||||||||
|
Gross
|
Gross
|
|||||||||||||||
|
Cost
|
Unrealized
|
Unrealized
|
Fair
|
|||||||||||||
|
Basis
|
Gains
|
Losses
|
Value
|
|||||||||||||
|
2009
|
||||||||||||||||
|
U.S.
government sponsored securities
|
$ | 1,993 | $ | 52 | $ | – | $ | 2,045 | ||||||||
|
CMO
and residential mortgage-backed securities
|
61,095 | 2,302 | (82 | ) | 63,315 | |||||||||||
|
Municipal
securities
|
34,151 | 1,516 | (94 | ) | 35,573 | |||||||||||
|
Corporate
debt securities
|
– | – . | – | – | ||||||||||||
|
CMO
government sponsored entities
|
22,534 | 168 | (209 | ) | 22,493 | |||||||||||
|
Collateralized
debt obligations
|
5,343 | – . | (3,993 | ) | 1,350 | |||||||||||
|
Total
debt securities
|
$ | 125,116 | $ | 4,038 | $ | (4,378 | ) | $ | 124,776 | |||||||
|
2008
|
||||||||||||||||
|
U.S.
government sponsored securities
|
$ | 5,484 | $ | 137 | $ | – | $ | 5,621 | ||||||||
|
CMO
and residential mortgage-backed securities
|
63,520 | 1,856 | (7 | ) | 65,369 | |||||||||||
|
Municipal
securities
|
26,952 | 259 | (532 | ) | 26,679 | |||||||||||
|
Corporate
debt securities
|
5,079 | – . | (266 | ) | 4,813 | |||||||||||
|
CMO
government sponsored entities
|
3,756 | 97 | (1 | ) | 3,852 | |||||||||||
|
Collateralized
debt obligations
|
5,481 | – . | (3,608 | ) | 1,873 | |||||||||||
|
Total
debt securities
|
$ | 110,272 | $ | 2,349 | $ | (4,414 | ) | $ | 108,207 | |||||||
|
(Dollars in thousands)
|
||||||||||||||||
|
Gross
|
Gross
|
|||||||||||||||
|
Cost
|
Unrecognized
|
Unrecognized
|
Fair
|
|||||||||||||
|
Basis
|
Gains
|
Losses
|
Value
|
|||||||||||||
|
2009
|
||||||||||||||||
|
Municipal
securities
|
$ | 18,539 | $ | 724 | $ | – | $ | 19,263 | ||||||||
|
Residential
mortgage-backed securities
|
1,018 | 28 | (6 | ) | 1,040 | |||||||||||
|
Total
debt securities
|
$ | 19,557 | $ | 752 | $ | (6 | ) | $ | 20,303 | |||||||
|
2008
|
||||||||||||||||
|
Municipal
securities
|
$ | 18,127 | $ | 117 | $ | (263 | ) | $ | 17,981 | |||||||
|
Residential
mortgage-backed securities
|
388 | 16 | – | 404 | ||||||||||||
|
Total
debt securities
|
$ | 18,515 | $ | 133 | $ | (263 | ) | $ | 18,385 | |||||||
|
(Dollars in thousands)
|
||||||||||||
|
Available-for-sale
|
Held-to-maturity
|
|||||||||||
|
Fair
|
Carrying
|
Fair
|
||||||||||
|
Value
|
Amount
|
Value
|
||||||||||
|
Due
in one year or less
|
$ | 191 | $ | 920 | $ | 921 | ||||||
|
Due
from one to five years
|
4,144 | – | – | |||||||||
|
Due
over five years
|
34,633 | 17,619 | 18,342 | |||||||||
|
CMO
and mortgage-backed securities
|
85,808 | 1,018 | 1,040 | |||||||||
|
Total
|
$ | 124,776 | $ | 19,557 | $ | 20,303 | ||||||
|
(Dollars in thousands)
|
||||||||
|
2009
|
2008
|
|||||||
|
Proceeds
|
$ | 29,933 | $ | 11,203 | ||||
|
Gross
gains
|
736 | 214 | ||||||
|
Gross
losses
|
– | (5 | ) | |||||
|
(Dollars in thousands)
|
||||||||||||||||||||||||
|
Less than
|
12 months
|
|||||||||||||||||||||||
|
12
months
|
or
longer
|
Total
|
||||||||||||||||||||||
|
Fair
|
Unrealized
|
Fair
|
Unrealized
|
Fair
|
Unrealized
|
|||||||||||||||||||
|
Value
|
Losses
|
Value
|
Losses
|
Value
|
Losses
|
|||||||||||||||||||
|
2009
|
||||||||||||||||||||||||
|
Description
of Securities:
|
||||||||||||||||||||||||
|
U.S.
government sponsored entities
|
$ | – | $ | – | $ | – | $ | – | $ | – | $ | – | ||||||||||||
|
CMO
and residential mortgage-backed securities
|
15,604 | (297 | ) | 13 | – | 15,617 | (297 | ) | ||||||||||||||||
|
Municipal
securities
|
2,443 | (15 | ) | 1,476 | (79 | ) | 3,919 | (94 | ) | |||||||||||||||
|
Corporate
debt securities
|
– | – | – | – | – | – | ||||||||||||||||||
|
Collateralized
debt obligations
|
– | – | 1,350 | (3,993 | ) | 1,350 | (3,993 | ) | ||||||||||||||||
|
Total
temporarily impaired
|
$ | 18,047 | $ | (312 | ) | $ | 2,839 | $ | (4,072 | ) | $ | 20,886 | $ | (4,384 | ) | |||||||||
|
Number
of securities
|
16 | 7 | 23 | |||||||||||||||||||||
|
(Dollars in thousands)
|
||||||||||||||||||||||||
|
Less than
|
12 months
|
|||||||||||||||||||||||
|
12
months
|
or
longer
|
Total
|
||||||||||||||||||||||
|
Fair
|
Unrealized
|
Fair
|
Unrealized
|
Fair
|
Unrealized
|
|||||||||||||||||||
|
Value
|
Losses
|
Value
|
Losses
|
Value
|
Losses
|
|||||||||||||||||||
|
2008
|
||||||||||||||||||||||||
|
Description
of Securities:
|
||||||||||||||||||||||||
|
U.S.
government sponsored entities
|
$ | – | $ | – | $ | 104 | $ | (1 | ) | $ | 104 | $ | (1 | ) | ||||||||||
|
CMO
and residential mortgage-backed securities
|
1,368 | (3 | ) | 371 | (4 | ) | 1,739 | (7 | ) | |||||||||||||||
|
Municipal
securities
|
25,924 | (795 | ) | – | – | 25,924 | (795 | ) | ||||||||||||||||
|
Corporate
debt securities
|
4,813 | (266 | ) | – | – | 4,813 | (266 | ) | ||||||||||||||||
|
Collateralized
debt obligations
|
1,409 | (2,640 | ) | 464 | (968 | ) | 1,873 | (3,608 | ) | |||||||||||||||
|
Total
temporarily impaired
|
$ | 33,514 | $ | (3,704 | ) | $ | 939 | $ | (973 | ) | $ | 34,453 | $ | (4,677 | ) | |||||||||
|
Number
of securities
|
79 | 6 | 85 | |||||||||||||||||||||
|
(Dollars in thousands)
|
||||||||
|
2009
|
2008
|
|||||||
|
Loans
secured by real estate:
|
||||||||
|
Construction
and land development
|
$ | 53,288 | $ | 54,975 | ||||
|
Residential,
including home equity
|
184,730 | 238,638 | ||||||
|
Commercial
real estate and other dwelling
|
141,443 | 130,256 | ||||||
|
Total
loans secured by real estate
|
379,461 | 423,869 | ||||||
|
Consumer
loans
|
1,505 | 1,967 | ||||||
|
Commercial
business
|
63,145 | 49,418 | ||||||
|
Government
and other
|
14,474 | 14,783 | ||||||
|
Subtotal
|
458,585 | 490,037 | ||||||
|
Less:
|
||||||||
|
Net
deferred loan origination fees
|
(285 | ) | (347 | ) | ||||
|
Undisbursed
loan funds
|
(55 | ) | (181 | ) | ||||
|
Loans
receivable
|
$ | 458,245 | $ | 489,509 | ||||
|
(Dollars in thousands)
|
||||||||
|
2009
|
2008
|
|||||||
|
Balance
at beginning of period
|
$ | 5,830 | $ | 4,581 | ||||
|
Provision
charged to income
|
8,540 | 2,388 | ||||||
|
Loans
charged-off
|
(8,440 | ) | (1,227 | ) | ||||
|
Recoveries
|
184 | 88 | ||||||
|
Balance
at end of period
|
$ | 6,114 | $ | 5,830 | ||||
|
(Dollars in thousands)
|
||||||||
|
2009
|
2008
|
|||||||
|
Loans
past due over 90 days still on accrual
|
$ | 1,491 | $ | 1,476 | ||||
|
Non-accrual
loans
|
17,074 | 10,937 | ||||||
|
(Dollars in thousands)
|
||||||||
|
2009
|
2008
|
|||||||
|
Year
end loans with no allocated allowances for loan losses
|
$ | 3,853 | $ | 1,748 | ||||
|
Year
end loans with allocated allowances for loan losses (including troubled
debt restructurings of $7,199 and 0)
|
13,112 | 6,819 | ||||||
|
Total
|
$ | 16,965 | $ | 8,567 | ||||
|
Amount
of the allowance for loan losses allocated
|
$ | 1,179 | $ | 1,683 | ||||
|
Average
of impaired loans during the year
|
12,820 | 7,393 | ||||||
|
Interest
income recognized during impairment
|
– | – | ||||||
|
Cash-basis
interest income recognized
|
– | – | ||||||
|
(Dollars in thousands)
|
||||||||
|
2009
|
2008
|
|||||||
|
Mortgage
loan portfolio serviced for FHLMC
|
$ | 51,512 | $ | 43,212 | ||||
|
(Dollars in thousands)
|
||||||||
|
2009
|
2008
|
|||||||
|
Servicing
rights:
|
||||||||
|
Beginning
of year
|
$ | 276 | $ | 325 | ||||
|
Additions
|
177 | 49 | ||||||
|
Amortized
to expense
|
(144 | ) | (98 | ) | ||||
|
End
of year
|
$ | 309 | $ | 276 | ||||
|
(Dollars in thousands)
|
||||
|
2010
|
$ | 85 | ||
|
2011
|
72 | |||
|
2012
|
61 | |||
|
2013
|
52 | |||
|
2014
|
39 | |||
|
(Dollars in thousands)
|
||||||||
|
2009
|
2008
|
|||||||
|
Cost:
|
||||||||
|
Land
|
$ | 5,069 | $ | 5,069 | ||||
|
Buildings
and improvements
|
17,939 | 16,821 | ||||||
|
Furniture
and equipment
|
10,194 | 9,383 | ||||||
|
Total
cost
|
33,202 | 31,273 | ||||||
|
Less
accumulated depreciation
|
(13,612 | ) | (12,190 | ) | ||||
|
Premises
and equipment, net
|
$ | 19,590 | $ | 19,083 | ||||
|
(Dollars in thousands)
|
||||||||
|
2009
|
2008
|
|||||||
|
Commercial
real estate and other dwelling
|
$ | 1,897 | $ | – | ||||
|
Residential
real estate
|
1,082 | 450 | ||||||
|
Construction
and land development
|
768 | 77 | ||||||
|
Total
|
$ | 3,747 | $ | 527 | ||||
|
(Dollars in thousands)
|
||||||||
|
2009
|
2008
|
|||||||
|
Federal:
|
||||||||
|
Current
|
$ | (365 | ) | $ | 1,825 | |||
|
Deferred
|
(134 | ) | (305 | ) | ||||
|
State:
|
||||||||
|
Current
|
6 | – | ||||||
|
Deferred
|
(320 | ) | (75 | ) | ||||
|
Income
tax (benefit) expense
|
$ | (813 | ) | $ | 1,445 | |||
|
(Dollars in thousands)
|
||||||||
|
2009
|
2008
|
|||||||
|
Federal
statutory rate
|
34 | % | 34 | % | ||||
|
Tax
expense at statutory rate
|
$ | 569 | $ | 2,507 | ||||
|
State
tax, net of federal effect
|
(201 | ) | (49 | ) | ||||
|
Tax
exempt income
|
(937 | ) | (686 | ) | ||||
|
Bank
owned life insurance
|
(138 | ) | (140 | ) | ||||
|
Tax
credits
|
(112 | ) | (114 | ) | ||||
|
Reversal
of FIN 48
|
– | (84 | ) | |||||
|
Other
|
6 | 11 | ||||||
|
Total
income tax (benefit) expense
|
$ | (813 | ) | $ | 1,445 | |||
|
(Dollars in thousands)
|
||||||||
|
2009
|
2008
|
|||||||
|
Deferred
tax assets:
|
||||||||
|
Bad
debts
|
$ | 2,404 | $ | 2,276 | ||||
|
Deferred
loan fees
|
112 | 136 | ||||||
|
Deferred
compensation
|
636 | 609 | ||||||
|
Unrealized
depreciation on securities available-for-sale
|
92 | 690 | ||||||
|
Net
operating loss
|
709 | 276 | ||||||
|
Tax
credits
|
269 | 24 | ||||||
|
Nonaccrual
loan interest income
|
79 | 37 | ||||||
|
Restricted
stock awards
|
39 | 73 | ||||||
|
REO
writedowns
|
66 | 19 | ||||||
|
Unqualified
DCP
|
42 | 38 | ||||||
|
Post
retirement benefit
|
65 | 75 | ||||||
|
Other-than-temporary
impairment
|
46 | – | ||||||
|
Other
|
6 | 9 | ||||||
|
Total
deferred tax assets
|
4,565 | 4,262 | ||||||
|
Deferred
tax liabilities:
|
||||||||
|
Depreciation
|
(1,137 | ) | (894 | ) | ||||
|
Prepaids
|
(198 | ) | (196 | ) | ||||
|
Mortgage
servicing rights
|
(121 | ) | (108 | ) | ||||
|
Deferred
stock dividends
|
(115 | ) | (115 | ) | ||||
|
FAS
158 - unrealized gain
|
(56 | ) | (62 | ) | ||||
|
Other
|
(18 | ) | (62 | ) | ||||
|
Total
deferred tax liabilities
|
(1,645 | ) | (1,437 | ) | ||||
|
Valuation
allowance
|
(376 | ) | (143 | ) | ||||
|
Net
deferred tax assets
|
$ | 2,544 | $ | 2,682 | ||||
|
(Dollars in thousands)
|
||||||||
|
2009
|
2008
|
|||||||
|
Balance
at beginning of period
|
$ | – | $ | 47 | ||||
|
Additions
based on tax positions related to the current year
|
– | – | ||||||
|
Additions
for tax positions of prior years
|
– | 37 | ||||||
|
Reductions
for tax positions of prior years
|
– | 84 | ||||||
|
Reductions
due to the statute of limitations
|
– | – | ||||||
|
Settlements
|
– | – | ||||||
|
Balance
at end of period
|
$ | – | $ | – | ||||
|
(Dollars in thousands)
|
||||
|
2010
|
$ | 194,611 | ||
|
2011
|
29,740 | |||
|
2012
|
2,215 | |||
|
2013
|
242 | |||
|
2014
|
51 | |||
|
Total
|
$ | 226,859 | ||
|
(Dollars
in thousands)
|
||||||||
|
2009
|
2008
|
|||||||
|
Fixed rate
advances from the FHLB
|
$ | 33,000 | $ | 41,000 | ||||
|
Putable
advances from the FHLB
|
5,000 | 5,000 | ||||||
|
Line
of credit from the FHLB
|
8,464 | 2,044 | ||||||
|
Other
|
665 | 978 | ||||||
|
Total
|
$ | 47,129 | $ | 49,022 | ||||
|
(Dollars
in thousands)
|
||||||||
|
2009
|
2008
|
|||||||
|
Ending
balance
|
$ | 15,893 | $ | 25,773 | ||||
|
Average
balance during the year
|
21,333 | 16,301 | ||||||
|
Maximum
month-end balance during the year
|
23,451 | 25,773 | ||||||
|
Securities
underlying the agreements at year end:
|
||||||||
|
Carrying
value
|
27,394 | 37,414 | ||||||
|
Fair
value
|
27,394 | 37,414 | ||||||
|
Average
interest rate during the year
|
1.36 | % | 2.65 | % | ||||
|
Average
interest rate at year end
|
1.34 | % | 1.46 | % | ||||
|
(Dollars
in thousands)
|
||||||||
|
2009
|
2008
|
|||||||
|
Fixed
rate advances, maturing January 2010 through December 2013, at rates from
1.97% to 4.03% average rate:2009 - 2.98%; 2008 - 3.40%
|
$ | 33,000 | $ | 41,000 | ||||
|
Putable
advances, maturing February 2013 at a rate of 2.62%, average rate: 2009 -
2.62%; 2008 - 2.62%
|
5,000 | 5,000 | ||||||
|
(Dollars in thousands)
|
||||
|
2010
|
$ | 31,129 | ||
|
2011
|
3,000 | |||
|
2012
|
5,000 | |||
|
2013
|
8,000 | |||
|
Total
|
$ | 47,129 | ||
|
Minimum
|
||||||||||||||||||||||||
|
Required
To Be
|
||||||||||||||||||||||||
|
Well
Capitalized
|
||||||||||||||||||||||||
|
Minimum
Required
|
Under
Prompt
|
|||||||||||||||||||||||
|
for
Capital
|
Corrective
|
|||||||||||||||||||||||
|
Actual
|
Adequacy
Purposes
|
Action
Regulations
|
||||||||||||||||||||||
|
(Dollars
in millions)
|
Amount
|
Ratio
|
Amount
|
Ratio
|
Amount
|
Ratio
|
||||||||||||||||||
|
2009
|
||||||||||||||||||||||||
|
Total
capital to risk-weighted assets
|
$ | 58.7 | 11.5 | % | $ | 40.8 | 8.0 | % | $ | 51.0 | 10.0 | % | ||||||||||||
|
Tier
1 capital to risk-weighted assets
|
$ | 52.6 | 10.3 | % | $ | 20.4 | 4.0 | % | $ | 30.6 | 6.0 | % | ||||||||||||
|
Tier
1 capital to adjusted average assets
|
$ | 52.6 | 7.8 | % | $ | 20.1 | 3.0 | % | $ | 33.5 | 5.0 | % | ||||||||||||
|
2008
|
||||||||||||||||||||||||
|
Total
capital to risk-weighted assets
|
$ | 59.9 | 12.0 | % | $ | 39.9 | 8.0 | % | $ | 50.0 | 10.0 | % | ||||||||||||
|
Tier
1 capital to risk-weighted assets
|
$ | 54.1 | 10.8 | % | $ | 20.0 | 4.0 | % | $ | 29.9 | 6.0 | % | ||||||||||||
|
Tier
1 capital to adjusted average assets
|
$ | 54.1 | 8.2 | % | $ | 20.0 | 3.0 | % | $ | 33.1 | 5.0 | % | ||||||||||||
|
|
||||||||||||||||
|
Weighted
|
||||||||||||||||
|
Weighted
|
Average
|
|||||||||||||||
|
Average
|
Remaining
|
Aggregate
|
||||||||||||||
|
Exercise
|
Contractual
|
Intrinsic
|
||||||||||||||
|
Shares
|
Price
|
Term
|
Value
|
|||||||||||||
|
Outstanding
at beginning of year
|
70,597 | $ | 23.56 | |||||||||||||
|
Granted
|
– | – | ||||||||||||||
|
Exercised
|
(200 | ) | 20.50 | |||||||||||||
|
Forfeited
or expired
|
(4,650 | ) | 21.73 | |||||||||||||
|
Outstanding
at end of year
|
65,747 | $ | 23.69 | 2.2 | $ | – | ||||||||||
|
Vested
or expected to vest
|
65,747 | $ | 23.69 | 2.2 | $ | – | ||||||||||
|
Exercisable
at end of year
|
64,747 | $ | 23.62 | 2.1 | $ | – | ||||||||||
|
2009
|
2008
|
|||||||
|
Risk-free
interest rate
|
– | 3.61% | ||||||
|
Expected
term
|
– |
10.0
years
|
||||||
|
Expected
stock price volatility
|
– | 26.55% | ||||||
|
Dividend
yield
|
– | 5.20% | ||||||
|
|
||||||||
|
Weighted
|
||||||||
|
Average
|
||||||||
|
Grant
Date
|
||||||||
|
Nonvested
Shares
|
Shares
|
Fair
Value
|
||||||
|
Nonvested
at January 1, 2009
|
7,550 | $ | 30.14 | |||||
|
Granted
|
2,500 | 18.95 | ||||||
|
Vested
|
(1,800 | ) | 30.50 | |||||
|
Forfeited
|
(700 | ) | 27.93 | |||||
|
Nonvested
at December 31, 2009
|
7,550 | $ | 26.55 | |||||
|
2009
|
2008
|
|||||||
|
Basic
earnings per common share:
|
||||||||
|
Net
income available to common stockholders
|
$ | 2,487,851 | $ | 5,930,255 | ||||
|
Weighted-average
common shares outstanding
|
2,814,488 | 2,809,176 | ||||||
|
Basic
earnings per common share
|
$ | 0.88 | $ | 2.11 | ||||
|
Diluted
earnings per common share:
|
||||||||
|
Net
income available to common stockholders
|
$ | 2,487,851 | $ | 5,930,255 | ||||
|
Weighted-average
common shares outstanding
|
2,814,488 | 2,809,176 | ||||||
|
Add:
dilutive effect of assumed stock option exercises and restricted
stock
|
– | 16,595 | ||||||
|
Weighted-average
common and dilutive potential common shares outstanding
|
2,814,488 | 2,825,771 | ||||||
|
Diluted
earnings per common share
|
$ | 0.88 | $ | 2.10 | ||||
|
(Dollars in thousands)
|
||||
|
Aggregate
balance - January 1, 2009
|
$ | 8,999 | ||
|
New
loans
|
1,200 | |||
|
Repayments
|
(374 | ) | ||
|
Aggregate
balance - December 31, 2009
|
$ | 9,825 | ||
|
(Dollars
in thousands)
|
||||||||||||
|
Fixed
|
Variable
|
|||||||||||
|
Rate
|
Rate
|
Total
|
||||||||||
|
December
31, 2009:
|
||||||||||||
|
Commercial
business
|
$ | – | $ | 58,493 | $ | 58,493 | ||||||
|
Real
estate
|
5,731 | 21,895 | 27,626 | |||||||||
|
Consumer
loans
|
– | 20 | 20 | |||||||||
|
Unsecured
consumer overdrafts
|
10,751 | – | 10,751 | |||||||||
|
Total
|
$ | 16,482 | $ | 80,408 | $ | 96,890 | ||||||
|
December
31, 2008:
|
||||||||||||
|
Commercial
business
|
$ | – | $ | 42,458 | $ | 42,458 | ||||||
|
Real
estate
|
11,890 | 28,618 | 40,508 | |||||||||
|
Consumer
loans
|
– | 17 | 17 | |||||||||
|
Unsecured
consumer overdrafts
|
12,345 | – | 12,345 | |||||||||
|
Total
|
$ | 24,235 | $ | 71,093 | $ | 95,328 | ||||||
|
(Dollars
in thousands)
|
||||
|
Collateralized
debt
|
||||
|
obligations
other-
|
||||
|
than-temporarily
|
||||
|
impaired
|
||||
|
Ending
balance - December 31, 2008
|
$ | – | ||
|
Additions
not previously recognized
|
136 | |||
|
Ending
balance - December 31, 2009
|
$ | 136 | ||
|
Deal
name
|
PreTSL
XXIV
|
PreTSL
XXVII
|
Alesco
IX
|
Alesco
XVII
|
||||||||||||
|
Class
|
B-1 | C-1 | A-2A | B | ||||||||||||
|
Book
value
|
1,258,772 | 1,409,027 | 1,323,252 | 1,351,903 | ||||||||||||
|
Fair
value
|
250,849 | 263,336 | 646,350 | 189,462 | ||||||||||||
|
Unrealized
gains/(losses)
|
(1,007,922 | ) | (1,145,692 | ) | (676,902 | ) | (1,162,441 | ) | ||||||||
|
Lowest
credit rating assigned
|
Caa3
|
Ca
|
BB
|
Ca
|
||||||||||||
|
Number
of performing banks
|
57 | 30 | 63 | 40 | ||||||||||||
|
Number
of performing insurance companies
|
12 | 7 | 11 | n/a | ||||||||||||
|
Number
of issuers in default
|
9 | 3 | 7 | 6 | ||||||||||||
|
Number
of issuers in deferral
|
15 | 9 | 6 | 10 | ||||||||||||
|
Defaults
& deferrals as a % of performing collateral
|
29.40 | % | 21.20 | % | 28.64 | % | 38.79 | % | ||||||||
|
Subordination:
|
||||||||||||||||
|
As
a % of performing collateral
|
-10.09 | % | -12.77 | % | 22.82 | % | -1.33 | % | ||||||||
|
As
a % of performing collateral - adjusted for projected future
defaults
|
-18.76 | % | -18.95 | % | 14.05 | % | -10.62 | % | ||||||||
|
Other-than-temporary
impairment model assumptions:
|
||||||||||||||||
|
Defaults:
|
||||||||||||||||
|
Year
1 - issuer average
|
5.00 | % | 2.90 | % | 7.20 | % | 5.80 | % | ||||||||
|
Year
2 - issuer average
|
1.70 | % | 1.70 | % | 2.40 | % | 2.10 | % | ||||||||
|
Year
3 - issuer average
|
0.60 | % | 0.60 | % | 0.60 | % | 0.50 | % | ||||||||
|
>
3 Years- issuer average
|
(1 | ) | (1 | ) | (1 | ) | (1 | ) | ||||||||
|
Discount
rate - 3-month LIBOR plus implicit yield spread at
purchase
|
1.48 | % | 1.23 | % | 1.27 | % | 1.44 | % | ||||||||
|
Recovery
assumptions
|
(2 | ) | (2 | ) | (2 | ) | (2 | ) | ||||||||
|
Prepayments
|
0.00 | % | 0.00 | % | 0.00 | % | 0.00 | % | ||||||||
|
Other-than-temporary impairment
|
39,300 | 19,050 | 15,884 | 61,950 | ||||||||||||
|
(Dollars
in thousands)
|
||||||||||||||||
|
Fair
Value Measurements at December 31, 2009 Using
|
||||||||||||||||
|
Quoted
Prices
|
Significant
|
|||||||||||||||
|
in
Active
|
Other
|
Significant
|
||||||||||||||
|
Markets
for
|
Observable
|
Unobservable
|
||||||||||||||
|
December
31,
|
Identical
Assets
|
Inputs
|
Inputs
|
|||||||||||||
|
2009
|
(Level
1)
|
(Level
2)
|
(Level
3)
|
|||||||||||||
|
Assets:
|
||||||||||||||||
|
Available
for sale securities
|
$ | 124,776 | $ | – | $ | 123,426 | $ | 1,350 | ||||||||
|
(Dollars
in thousands)
|
||||||||||||||||
|
Fair
Value Measurements at December 31, 2008 Using
|
||||||||||||||||
|
Quoted
Prices
|
Significant
|
|||||||||||||||
|
in
Active
|
Other
|
Significant
|
||||||||||||||
|
Markets
for
|
Observable
|
Unobservable
|
||||||||||||||
|
December
31,
|
Identical
Assets
|
Inputs
|
Inputs
|
|||||||||||||
|
2008
|
(Level
1)
|
(Level
2)
|
(Level
3)
|
|||||||||||||
|
Assets:
|
||||||||||||||||
|
Available
for sale securities
|
$ | 108,207 | $ | – | $ | 107,204 | $ | 1,003 | ||||||||
|
(Dollars
in thousands)
|
||||
|
Fair
Value Measurements
|
||||
|
Using
Significant
|
||||
|
Unobservable
Inputs
|
||||
|
(Level
3)
|
||||
|
Available
for sale securities
|
||||
|
Beginning
balance - January 1, 2008
|
$ | – | ||
|
Included
in other comprehensive income
|
440 | |||
|
Transfers
in and/or out of Level 3
|
563 | |||
|
Ending
balance - December 31, 2008
|
1,003 | |||
|
Total
realized/unrealized losses
|
||||
|
Included
in earnings
|
(136 | ) | ||
|
Included
in other comprehensive income
|
33 | |||
|
Transfers
in and/or out of Level 3
|
450 | |||
|
Ending
balance - December 31, 2009
|
$ | 1,350 | ||
|
(Dollars
in thousands)
|
||||||||||||||||
|
Fair
Value Measurements at December 31, 2009 Using
|
||||||||||||||||
|
Quoted
Prices
|
Significant
|
|||||||||||||||
|
in
Active
|
Other
|
Significant
|
||||||||||||||
|
Markets
for
|
Observable
|
Unobservable
|
||||||||||||||
|
December
31,
|
Identical
Assets
|
Inputs
|
Inputs
|
|||||||||||||
|
2009
|
(Level
1)
|
(Level
2)
|
(Level
3)
|
|||||||||||||
|
Assets:
|
||||||||||||||||
|
Impaired
loans
|
$ | 11,933 | $ | – | $ | – | $ | 11,933 | ||||||||
|
Foreclosed
real estate
|
3,738 | – | – | 3,738 | ||||||||||||
|
(Dollars
in thousands)
|
||||||||||||||||
|
Fair
Value Measurements at December 31, 2008 Using
|
||||||||||||||||
|
Quoted
Prices
|
Significant
|
|||||||||||||||
|
in
Active
|
Other
|
Significant
|
||||||||||||||
|
Markets
for
|
Observable
|
Unobservable
|
||||||||||||||
|
December
31,
|
Identical
Assets
|
Inputs
|
Inputs
|
|||||||||||||
|
2008
|
(Level
1)
|
(Level
2)
|
(Level
3)
|
|||||||||||||
|
Assets:
|
||||||||||||||||
|
Impaired
loans
|
$ | 5,523 | $ | – | $ | 2,789 | $ | 2,734 | ||||||||
|
Foreclosed
real estate
|
527 | – | – | 527 | ||||||||||||
|
(Dollars
in thousands)
|
||||||||
|
December
31,
2009
|
||||||||
|
Carrying
|
Estimated
|
|||||||
|
Value
|
Fair
Value
|
|||||||
|
Financial
assets
|
||||||||
|
Cash
and cash equivalents
|
$ | 13,222 | $ | 13,222 | ||||
|
Securities
available-for-sale
|
124,776 | 124,776 | ||||||
|
Securities
held-to-maturity
|
19,557 | 20,303 | ||||||
|
Loans
held for sale
|
1,025 | 1,025 | ||||||
|
Loans
receivable, net
|
452,131 | 498,005 | ||||||
|
Federal
Home Loan Bank stock
|
3,650 | 3,650 | ||||||
|
Accrued
interest receivable
|
2,878 | 2,878 | ||||||
|
Financial
liabilities
|
||||||||
|
Demand
and savings deposits
|
313,669 | 313,669 | ||||||
|
Certificates
of deposit
|
226,858 | 227,672 | ||||||
|
Repurchase
agreements
|
15,893 | 15,525 | ||||||
|
Borrowed
funds
|
47,129 | 38,932 | ||||||
|
Accrued
interest payable
|
150 | 150 | ||||||
|
(Dollars
in thousands)
|
||||||||
|
December
31,
2008
|
||||||||
|
Carrying
|
Estimated
|
|||||||
|
Value
|
Fair
Value
|
|||||||
|
Financial
assets
|
||||||||
|
Cash
and cash equivalents
|
$ | 11,296 | $ | 11,296 | ||||
|
Securities
available-for-sale
|
108,207 | 108,207 | ||||||
|
Securities
held-to-maturity
|
18,515 | 18,385 | ||||||
|
Loans
held for sale
|
– | – | ||||||
|
Loans
receivable, net
|
483,679 | 533,377 | ||||||
|
Federal
Home Loan Bank stock
|
3,650 | 3,650 | ||||||
|
Accrued
interest receivable
|
3,160 | 3,160 | ||||||
|
Financial
liabilities
|
||||||||
|
Demand
and savings deposits
|
297,076 | 297,076 | ||||||
|
Certificates
of deposit
|
231,072 | 232,926 | ||||||
|
Repurchase
agreements
|
25,773 | 25,464 | ||||||
|
Borrowed
funds
|
49,022 | 49,702 | ||||||
|
Accrued
interest payable
|
256 | 256 | ||||||
|
(Dollars
in thousands)
|
||||||||
|
2009
|
2008
|
|||||||
|
Net
change in net unrealized gains and losses
on securities available for sale:
|
||||||||
|
Unrealized
gains/(losses) arising during
the year
|
$ | 1,125 | $ | (2,981 | ) | |||
|
Reclassification
adjustment for gains included
in net income
|
600 | 210 | ||||||
|
Net
securities gain/(loss) during the year
|
1,725 | (2,771 | ) | |||||
|
Tax
effect
|
(597 | ) | 930 | |||||
|
Net
of tax amount
|
1,128 | (1,841 | ) | |||||
|
Net
change in unrecognized gain on post
retirement benefit:
|
||||||||
|
Net
gain/(loss) on post retirement benefit
|
6 | 5 | ||||||
|
Amortization
of net actuarial gain
|
(15 | ) | (16 | ) | ||||
|
Net
gain/(loss) activity during the year
|
(9 | ) | (11 | ) | ||||
|
Tax
effect
|
– | – | ||||||
|
Net
of tax amount
|
(9 | ) | (11 | ) | ||||
|
Other
comprehensive income (loss), net of tax
|
$ | 1,119 | $ | (1,852 | ) | |||
|
(Dollars
in thousands)
|
||||||||||||
|
Balance
at
|
Current
|
Balance
at
|
||||||||||
|
December
31,
|
Period
|
December
31,
|
||||||||||
|
2008
|
Change
|
2009
|
||||||||||
|
Unrealized
gains (losses) on securities available for
sale
|
$ | (1,375 | ) | $ | 1,128 | $ | (247 | ) | ||||
|
Unrealized
gain (loss) on pension benefits
|
86 | (9 | ) | 77 | ||||||||
|
Total
|
$ | (1,289 | ) | $ | 1,119 | $ | (170 | ) | ||||
|
(Dollars
in thousands)
|
||||||||
|
NorthWest
Indiana Bancorp
|
||||||||
|
Condensed
Balance Sheets
|
||||||||
|
December
31,
|
||||||||
|
2009
|
2008
|
|||||||
|
Assets
|
||||||||
|
Cash
on deposit with Peoples Bank
|
$ | 2,691 | $ | 1,867 | ||||
|
Investment
in Peoples Bank
|
52,212 | 51,384 | ||||||
|
Dividends
receivable from Peoples Bank
|
– | 1,012 | ||||||
|
Other
assets
|
107 | 219 | ||||||
|
Total
assets
|
$ | 55,010 | $ | 54,482 | ||||
|
Liabilities
and stockholders’ equity
|
||||||||
|
Dividends
payable
|
$ | 594 | $ | 1,011 | ||||
|
Other
liabilities
|
1,338 | 698 | ||||||
|
Total
liabilities
|
1,932 | 1,709 | ||||||
|
Common
stock
|
361 | 361 | ||||||
|
Additional
paid in capital
|
5,104 | 5,064 | ||||||
|
Accumulated
other comprehensive income (loss)
|
(170 | ) | (1,289 | ) | ||||
|
Retained
earnings
|
49,312 | 50,365 | ||||||
|
Treasury
stock
|
(1,529 | ) | (1,728 | ) | ||||
|
Total
stockholders’ equity
|
53,078 | 52,773 | ||||||
|
Total
liabilities and stockholders’ equity
|
$ | 55,010 | $ | 54,482 | ||||
|
(Dollars
in thousands)
|
||||||||
|
NorthWest
Indiana Bancorp
|
||||||||
|
Condensed
Statements of Income
|
||||||||
|
Year
Ended December 31,
|
||||||||
|
2009
|
2008
|
|||||||
|
Dividends
from Peoples Bank
|
$ | 2,813 | $ | 4,047 | ||||
|
Operating
expenses
|
176 | 161 | ||||||
|
Income
before income taxes and equity in undistributed income of Peoples
Bank
|
2,637 | 3,886 | ||||||
|
Income
tax benefit
|
(58 | ) | (61 | ) | ||||
|
Income
before equity in undistributed income of Peoples Bank
|
2,695 | 3,947 | ||||||
|
Equity/(loss)
in undistributed income of Peoples Bank
|
(207 | ) | 1,983 | |||||
|
Net
income
|
$ | 2,488 | $ | 5,930 | ||||
|
(Dollars
in thousands)
|
||||||||
|
NorthWest
Indiana Bancorp
|
||||||||
|
Condensed
Statements of Cash Flows
|
||||||||
|
Year
Ended December 31,
|
||||||||
|
2009
|
2008
|
|||||||
|
Cash
flows from operating activities:
|
||||||||
|
Net
income
|
$ | 2,488 | $ | 5,930 | ||||
|
Adjustments
to reconcile net income to net cash from operating
activities
|
||||||||
|
Equity
in undistributed net income of Peoples Bank
|
207 | (1,983 | ) | |||||
|
Stock-based
compensation expense
|
40 | 57 | ||||||
|
Change
in other assets
|
1,123 | 33 | ||||||
|
Change
in other liabilities
|
224 | 151 | ||||||
|
Total
adjustments
|
1,594 | (1,742 | ) | |||||
|
Net
cash from operating activities
|
4,082 | 4,188 | ||||||
|
Cash
flows from investing activities
|
– | – | ||||||
|
Cash
flows from financing activities:
|
||||||||
|
Dividends
paid
|
(3,405 | ) | (4,045 | ) | ||||
|
Treasury
stock purchased
|
– | (226 | ) | |||||
|
Sale
of treasury stock
|
141 | 83 | ||||||
|
Proceeds
from issuance of common stock
|
6 | 113 | ||||||
|
Net
cash used in financing activities
|
(3,258 | ) | (4,075 | ) | ||||
|
Net
change in cash
|
824 | 113 | ||||||
|
Cash
at beginning of year
|
1,867 | 1,754 | ||||||
|
Cash
at end of year
|
$ | 2,691 | $ | 1,867 | ||||
|
Dividends
|
|||||||||||||
|
Per
Share Prices
|
Declared
Per
|
||||||||||||
|
High
|
Low
|
Common
Share
|
|||||||||||
| Year Ended | |||||||||||||
|
December
31, 2009
|
1st
Quarter
|
$ | 24.00 | $ | 16.00 | $ | 0.36 | ||||||
|
|
2nd
Quarter
|
20.00 | 18.25 | 0.32 | |||||||||
|
3rd
Quarter
|
20.50 | 17.00 | 0.32 | ||||||||||
|
4th
Quarter
|
19.95 | 17.25 | 0.21 | ||||||||||
|
Year
Ended
|
|||||||||||||
|
December
31, 2008
|
1st
Quarter
|
$ | 29.90 | $ | 23.10 | $ | 0.36 | ||||||
|
|
2nd
Quarter
|
27.25 | 26.00 | 0.36 | |||||||||
|
3rd
Quarter
|
29.00 | 26.00 | 0.36 | ||||||||||
|
4th
Quarter
|
27.25 | 24.00 | 0.36 | ||||||||||