
2012 Annual Report
| David A. Bochnowski | |
| Chairman and | |
| Chief Executive Officer |
Dear Shareholder:
2012 will be remembered as a noteworthy year for banking as our economy recovers from the effects of the Great Recession. The outlook has brightened for Northwest Indiana as job losses stabilized with some jobs returning in the manufacturing sector, although not at the pace that would hasten the recovery. Other positive signs include an upswing in housing prices, the strengthening of exports, and consumer households shedding record high debt and returning to their lowest levels since 1993.
Across the nation and locally, community banks are emerging from the Great Recession with balance sheets that demonstrate historically high levels of capital as well as core deposits. Banks are poised to provide the fuel for household and small business growth, but policy uncertainty by our national government has hampered the emergence of a consistent upward trend of confidence in the economy.
Record Income
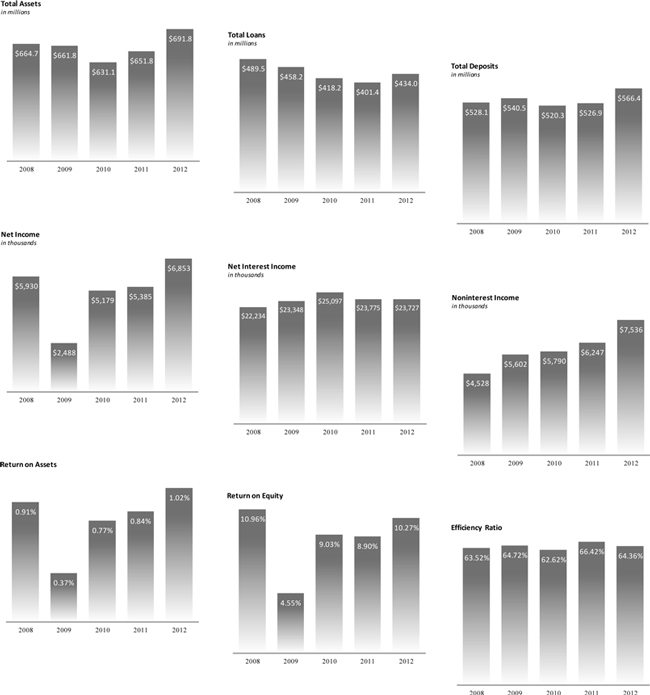
2012 proved to be our best year of performance ever for the Northwest Indiana Bancorp and Peoples Bank as our community banking effort provided record income of $6.9 million.
Our results reflect a 27.3% jump in earnings over last year and were driven by loan and core deposit growth, improved asset quality, increased income from banking operations, and stable operating expenses. At year end, our loan balances were up 8.9% over 2011, core deposits were up 12.8%, non-performing loans decreased 19.6%, income from banking operations increased 20.6%, and our operating costs rose only 1% as management carefully controlled expenses to meet the challenges of current economic conditions.
The Bancorp’s key ratios outperformed the industry as we reported an average return on assets (ROA) of 1.02% and a return on equity (ROE) of 10.27%. Our earnings per share increased 26.8% over the prior year and the book value per share of your stock rose to $23.83 at year end.
Strategic Focus
Banking in general, and especially community banks, face the retooling of traditional business models as the most comprehensive banking reforms in 70 years have brought forth new regulatory and compliance requirements. Stakeholders are demanding improved enterprise risk management practices designed to identify and limit risks that could threaten the stability of an individual bank, as well as, bring on systemic risks to the banking system.
The Great Recession and its lingering effects have changed banking in meaningful ways. From new regulations to shifts in our local market, a “new normal” has emerged for banking with an emphasis on higher levels of capital along with streamlined operations.
| 1 |
In the 21st century, community banks will need to shift organization structures so that we remain relevant and drive sustainable performance that differentiates community bankers from larger, impersonal banking companies.
Your Bank will maintain our commitment to serving the credit needs of our consumer and business customers. At the same time we will take advantage of technology to improve customer service by meeting the ever increasing demand of mobile savvy customers for 24/7 access to banking through such services as mobile payments, mobile wallets and remote deposit capture.
The Board of Directors has adopted a five year strategic plan that affirms our commitment to remaining an independent community bank. We plan to achieve a larger scale that will help the Bank absorb increased regulatory and operational costs and reinvest in growing our core business, while continuing to deliver an exceptional “You First Banking” customer experience.
Our franchise will be built on three pillars: asset growth, core funding growth, and income growth, including wealth management, with the pillars resting on a platform of a rigorous Enterprise Risk Management (ERM) program. ERM will support strategic direction rather than dictate strategy. Management will define opportunities for growth and ERM will serve to ensure that value from those opportunities is realized safely.
Leadership
Joel Gorelick, president and chief operating officer of Peoples Bank and the Bancorp since 2005, announced his decision to retire early last year and did so in January of 2013.
When Joel joined the Bank in 1983 as Vice President for Commercial Lending, we had a vision for a community bank that would serve the needs of consumers and small business with exceptional service and competitive products. We have succeeded due to the effort of the entire Peoples team and, in no small measure, to Joel’s leadership ability in understanding the needs of consumer and small business borrowers while providing insight into the Bank’s strategic direction. Throughout his career, Joel has also been recognized for his involvement and leadership in a wide range of community activities and causes.
Every day for the last three decades, Joel has come to work with energy, commitment, and passion for serving the Bank’s customers and community. Although he will no longer have day to day responsibilities at the Bank, and we will miss him, we are pleased that the Bancorp and Peoples Bank will continue to benefit from Joel’s expertise as a director and consultant in our effort to build a unique community bank serving the needs of our customers and community.
During the year, two valuable members of the Peoples team passed away. Marilyn Repp, our Vice-President and Senior Banking Center Manager, joined the Bank in 1981 as a teller. Jane Bridgman came on board in 2003 as a consumer loan processor and later became our Vice-President, Credit Administration Manager. Both of these outstanding women uniquely contributed to the Bank’s success with their highly-skilled performance and commitment to the customers they served. Their presence will be missed, but their legacy will endure in our You First Banking culture.
Shareholder Value
This year’s results demonstrate the ability of the Peoples team to stay on course and successfully engage traditional banking principles that deliver sustainable growth. We focused on growing earnings and capital, improving asset quality, and holding the line on operating expenses.
| 2 |
The market recognized the strength of our performance as the price of our stock increased 32.6% during the year, rising from $14.40 per share at the end of 2011 compared to $19.10 per share on December 31, 2012.
Our core income, or net interest income, held steady during the year despite steadily falling asset yields due to the Federal Reserve’s continuation of its policy decision to maintain a historically low interest rate environment. Net interest income for the year totaled $23.7 million compared to $23.8 million in 2011, a remarkable achievement driven by our low cost of funds, significant core deposit growth, and loan growth.
At year-end, core deposits, which include checking, savings, and money market accounts, totaled $394.7 million, an increase of $44.8 million or 12.8%. Core accounts represent 69.7% of total deposits, with additional growth as a high strategic priority. Loan growth also assisted in sustaining our net interest margin as the loan portfolio grew $35.6 million or 8.9% compared to the prior year.
The beginning of the economic recovery spurred on borrower demand across residential and small business customers. Attractive rates for home loans drove both new home purchases and the refinance of home loans while credit facilities for small business customers increased. Local governments also increased their borrowings in anticipation of revenue due from tax collections. Growing our relationships with small business customers and local government units continues to be a strategic priority.
Our strong earnings performance drove our capital ratios to new highs during the year. Tangible equity capital stood at $67.7 million, or 9.8% of total assets at the end of December 2012. Under all regulatory capital requirements, the Bancorp is considered well capitalized with our tier 1 capital at 9.4%, 14.6% for total capital to risk based assets, and 13.4% for tier 1 capital to risk-weighted assets.
The combination of our capital strength and consistent core earnings will position the Bank to act on growth opportunities to expand our operation to better serve our customers and community.
Improving asset quality in the aftermath of the Great Recession has been a focal point of management over the last several years and 2012 was no exception. At the end of 2012, non-performing loans totaled $11.5 million, a decrease of 19.6% over the prior year. Our ratio of non-performing assets to total assets declined to 1.84% at the end of 2012, compared to 2.68% a year earlier. Management anticipates further declines in non-performing loans during 2013 as the disposition of loan workouts initiated during 2012 are completed.
As the “new normal” dawns on banking, operating expenses will be closely scrutinized for greater efficiency. Doing more with less is the new normal and our 2012 operating costs provide a guidepost for the future. During the last year, operating expenses rose only 1% as management took action to reduce occupancy, equipment, data processing, and marketing costs consistent with the new reality of banking.
| 3 |
Your Board of Directors was pleased to respond to our positive earnings track during the year by raising our dividend 26.7% from $.15 per share to $.19 per share. The Board will continue to review our dividend policy each year and, among other factors, will take into consideration in its decision matrix the Bancorp’s income, capital needs, and a dividend payout ratio range of 30% to 40% of earnings.
Customer Value
Remaining relevant and providing up to date products and services for our customers will be critical to the long-term growth of community banks. Fortunately, and unlike some other banks who have made headlines, we do not have to repair our public image as a result of issues related to poor performance or reliance on government assistance programs viewed as “bailouts.” Our customer surveys and unsolicited social media comments confirm the success of our “You First Banking” philosophy that provides value and an unparalleled banking experience to our customers. The public continues to put their trust in community banks and, specifically, Peoples Bank.
Your company has weathered the negative perception of banking and emerged even stronger as evidenced by increased customer utilization of our products and services during the year. Not only did we experience record earnings but also our assets grew to $691.8 million resulting from our core account and loan growth. Our 6.2% asset growth rate during the year reflects our consistent effort to garner a higher wallet share from our existing customers and to attract new customers to our brand.
We launched a “Brand Refresh” during the year to carry the philosophy of You First Banking to a broader audience with a new, contemporary look and messaging, emphasizing our commitment to build relationships with our customers and provide appropriate channels for the delivery of our products and services. A prime example of this commitment is the work that began in the fall of 2012 to transform the Bank’s website into an eBranch, enabling us to bring Peoples Bank to our customers and engage them whether they are on their phone, their laptop, or on their home computer.
We are committed to keeping pace with increasing customer preferences for technology-based banking. Our surveys of the Bank’s younger demographic customers substantiated these preferences, and we have also noted that baby boomer customers mirror some of the same expectations. As a result, work also began on plans to deliver mobile banking upgrades like check deposit, business mobile banking, and an iPad application.
Working with our small business customers to build relationships through an understanding of their unique individual needs is the central focus of our You First Banking approach to commercial banking. Our business bankers work to define a pathway for the success of their business customers. We are proud to note that Peoples Bank was awarded the 2012 Lender of the Year award by the Regional Development Company.
| 4 |
Community Value
As a community banking organization, we are committed to serving the needs of our community through financial support and through volunteering in numerous community and faith based organizations. We recognize that a community gathers strength from the well being of its neighborhoods and that neighborhoods gather strength from community organizations.
During the year, our team served side by side with our friends and neighbors to pool our talent and sustain and improve the quality of life in our community. We maintained our commitment to the “Bank On” initiative with the Lake Area United Way to provide banking services to the unbanked and underbanked of our community. And, we continued our financial literacy effort by teaming with the Boys and Girls Clubs of Lake County to teach financial awareness to the youth of our community. Our Community Reinvestment team continued their outreach to forge new relationships and create innovative ways to revitalize neighborhoods.
The Bank’s Community First Committee (CFC), run entirely by employees, again this year set a new record for fund raising among our employees despite the challenges of the economy. Our CFC provided financial support for numerous organizations including the Boys and Girls Clubs of Lake and Porter counties, Haven House, Neighborhoods Inc., Opportunity Enterprises, Legacy Foundation, and the Food Bank of Northwest Indiana. Community First also joined with the Bank in supporting the Boys and Girls Club Tolleston capital campaign. In addition, Peoples Bank provided financial assistance to over 150 community organizations during the year.
Banking on Our Future
Like many of our shareholders and customers, the Bank was buffeted by the ill winds of the Great Recession, but we are wiser and stronger for the experience. However, unlike many banks, we were able to continue to pay a dividend throughout the stress of the last several years. We are grateful for the support of our shareholders and for your commitment to the Northwest Indiana Bancorp.
As the economy recovers, the Bancorp and our operating subsidiary, Peoples Bank, are well positioned to meet the challenges of our industry, just as we have been able to overcome the challenges of the recent past. Your Board of Directors and the entire Peoples team are cautiously optimistic about the future and bullish on the prospect of doing business in Northwest Indiana.
| Sincerely, | |
 | |
| David A. Bochnowski | |
| Chairman and Chief Executive Officer |
| 5 |
Financial Highlights
| 6 |
Selected Consolidated Financial Data
in thousands of dollars, except per share data
| Fiscal Year Ended | December 31, | December 31, | December 31, | December 31, | December 31, | December 31, | December 31, | December 31, | December 31, | December 31, | ||||||||||||||||||||||||||||||
| 2012 | 2011 | 2010 | 2009 | 2008 | 2007 | 2006 | 2005 | 2004 | 2003 | |||||||||||||||||||||||||||||||
| Statement of Income: | ||||||||||||||||||||||||||||||||||||||||
| Total interest income | $ | 26,075 | $ | 26,986 | $ | 30,086 | $ | 32,189 | $ | 35,167 | $ | 35,768 | $ | 34,979 | $ | 30,024 | $ | 26,614 | $ | 26,357 | ||||||||||||||||||||
| Total interest expense | 2,348 | 3,231 | 4,989 | 8,841 | 12,933 | 17,882 | 15,737 | 9,758 | 6,858 | 7,521 | ||||||||||||||||||||||||||||||
| Net interest income | 23,727 | 23,755 | 25,097 | 23,348 | 22,234 | 17,886 | 19,242 | 20,266 | 19,756 | 18,836 | ||||||||||||||||||||||||||||||
| Provision for loan losses | 2,350 | 3,510 | 5,570 | 8,540 | 2,388 | 552 | 15 | 245 | 385 | 420 | ||||||||||||||||||||||||||||||
| Net interest income after | ||||||||||||||||||||||||||||||||||||||||
| provision for loan losses | 21,377 | 20,245 | 19,527 | 14,808 | 19,846 | 17,334 | 19,227 | 20,021 | 19,371 | 18,416 | ||||||||||||||||||||||||||||||
| Noninterest income | 7,536 | 6,247 | 5,790 | 5,602 | 4,528 | 4,431 | 4,219 | 3,540 | 3,312 | 2,968 | ||||||||||||||||||||||||||||||
| Noninterest expense | 20,119 | 19,928 | 19,341 | 18,735 | 16,999 | 14,525 | 14,296 | 13,771 | 13,174 | 12,037 | ||||||||||||||||||||||||||||||
| Net noninterest expense | 12,583 | 13,681 | 13,551 | 13,133 | 12,471 | 10,094 | 10,077 | 10,231 | 9,862 | 9,069 | ||||||||||||||||||||||||||||||
| Income tax expenses/(benefit) | 1,941 | 1,179 | 797 | (813 | ) | 1,445 | 1,651 | 2,674 | 3,118 | 3,219 | 3,411 | |||||||||||||||||||||||||||||
| Cumulative effect of changes in accounting | - | - | - | - | - | - | - | - | - | - | ||||||||||||||||||||||||||||||
| Net income | $ | 6,853 | $ | 5,385 | $ | 5,179 | $ | 2,488 | $ | 5,930 | $ | 5,589 | $ | 6,475 | $ | 6,672 | $ | 6,290 | $ | 5,936 | ||||||||||||||||||||
| Basic earnings per common share | $ | 2.41 | $ | 1.90 | $ | 1.83 | $ | 0.88 | $ | 2.11 | $ | 1.99 | $ | 2.32 | $ | 2.40 | $ | 2.28 | $ | 2.16 | ||||||||||||||||||||
| Diluted earnings per common share | $ | 2.41 | $ | 1.90 | $ | 1.83 | $ | 0.88 | $ | 2.10 | $ | 1.98 | $ | 2.30 | $ | 2.37 | $ | 2.24 | $ | 2.13 | ||||||||||||||||||||
| Cash dividends declared per common share | $ | 0.72 | $ | 0.60 | $ | 0.72 | $ | 1.21 | $ | 1.44 | $ | 1.44 | $ | 1.40 | $ | 1.32 | $ | 1.24 | $ | 1.20 | ||||||||||||||||||||
| December 31, | December 31, | December 31, | December 31, | December 31, | December 31, | December 31, | December 31, | December 31, | December 31, | |||||||||||||||||||||||||||||||
| 2012 | 2011 | 2010 | 2009 | 2008 | 2007 | 2006 | 2005 | 2004 | 2003 | |||||||||||||||||||||||||||||||
| Balance Sheet: | ||||||||||||||||||||||||||||||||||||||||
| Total assets | $ | 691,845 | $ | 651,758 | $ | 631,053 | $ | 661,017 | $ | 664,732 | $ | 628,718 | $ | 617,518 | $ | 627,439 | $ | 557,393 | $ | 508,775 | ||||||||||||||||||||
| Loans receivable | 436,981 | 401,401 | 418,233 | 458,245 | 489,509 | 468,459 | 471,716 | 469,043 | 433,790 | 409,808 | ||||||||||||||||||||||||||||||
| Investment securities | 187,475 | 186,962 | 160,452 | 144,333 | 126,722 | 114,644 | 99,012 | 79,979 | 79,979 | 63,733 | ||||||||||||||||||||||||||||||
| Deposits | 566,409 | 526,881 | 520,271 | 540,527 | 528,148 | 512,931 | 512,931 | 525,731 | 451,573 | 421,640 | ||||||||||||||||||||||||||||||
| Borrowed funds | 49,505 | 52,013 | 48,618 | 63,022 | 74,795 | 76,930 | 51,501 | 51,152 | 57,201 | 40,895 | ||||||||||||||||||||||||||||||
| Total stockholders' equity | 67,651 | 62,960 | 56,089 | 53,078 | 52,773 | 52,733 | 49,902 | 46,433 | 44,097 | 41,554 | ||||||||||||||||||||||||||||||
| December 31, | December 31, | December 31, | December 31, | December 31, | December 31, | December 31, | December 31, | December 31, | December 31, | |||||||||||||||||||||||||||||||
| 2012 | 2011 | 2010 | 2009 | 2008 | 2007 | 2006 | 2005 | 2004 | 2003 | |||||||||||||||||||||||||||||||
| Interest Rate Spread During Period: | ||||||||||||||||||||||||||||||||||||||||
| Average effective yield on loans and investment securities | 4.14 | % | 4.50 | % | 4.84 | % | 5.16 | % | 5.78 | % | 6.21 | % | 6.02 | % | 5.49 | % | 5.31 | % | 5.65 | % | ||||||||||||||||||||
| Average effective cost of deposits and borrowings | 0.39 | % | 0.56 | % | 0.82 | % | 1.45 | % | 2.19 | % | 3.18 | % | 2.77 | % | 1.82 | % | 1.40 | % | 1.67 | % | ||||||||||||||||||||
| Interest rate spread | 3.75 | % | 3.94 | % | 4.02 | % | 3.71 | % | 3.59 | % | 3.03 | % | 3.25 | % | 3.67 | % | 3.91 | % | 3.98 | % | ||||||||||||||||||||
| Net interest margin | 3.77 | % | 3.96 | % | 4.04 | % | 3.74 | % | 3.65 | % | 3.10 | % | 3.31 | % | 3.71 | % | 3.94 | % | 4.04 | % | ||||||||||||||||||||
| Return on average assets | 1.02 | % | 0.84 | % | 0.77 | % | 0.37 | % | 0.91 | % | 0.91 | % | 1.04 | % | 1.14 | % | 1.17 | % | 1.20 | % | ||||||||||||||||||||
| Return on average equity | 10.27 | % | 8.90 | % | 9.03 | % | 4.55 | % | 10.96 | % | 10.78 | % | 13.42 | % | 14.67 | % | 14.64 | % | 14.65 | % | ||||||||||||||||||||
| December 31, | December 31, | December 31, | December 31, | December 31, | December 31, | December 31, | December 31, | December 31, | December 31, | |||||||||||||||||||||||||||||||
| 2012 | 2011 | 2010 | 2009 | 2008 | 2007 | 2006 | 2005 | 2004 | 2003 | |||||||||||||||||||||||||||||||
| Tier 1 capital to risk-weighted assets | 14.6 | % | 14.3 | % | 12.9 | % | 11.5 | % | 12.0 | % | 12.0 | % | 11.1 | % | 10.7 | % | 11.2 | % | 11.5 | % | ||||||||||||||||||||
| Total capital to risk-weighted assets | 13.4 | % | 13.1 | % | 11.7 | % | 10.3 | % | 10.8 | % | 11.0 | % | 12.1 | % | 11.6 | % | 12.2 | % | 12.5 | % | ||||||||||||||||||||
| Tier 1 capital leverage ratio | 9.4 | % | 9.2 | % | 8.5 | % | 7.8 | % | 8.2 | % | 8.3 | % | 8.0 | % | 7.9 | % | 8.0 | % | 8.0 | % | ||||||||||||||||||||
| Allowance for loan losses to total loans | 1.93 | % | 1.99 | % | 2.18 | % | 1.33 | % | 1.19 | % | 0.98 | % | 0.90 | % | 0.89 | % | 0.90 | % | 0.92 | % | ||||||||||||||||||||
| Allowance for loan losses to non-performing loans | 73.34 | % | 56.03 | % | 37.82 | % | 32.93 | % | 46.97 | % | 53.16 | % | 153.95 | % | 198.00 | % | 371.00 | % | 220.31 | % | ||||||||||||||||||||
| Non-performing loans to total loans | 2.63 | % | 3.56 | % | 5.77 | % | 4.05 | % | 2.54 | % | 1.02 | % | 0.58 | % | 0.45 | % | 0.24 | % | 0.42 | % | ||||||||||||||||||||
| Total loan accounts | 4,416 | 4,567 | 4,594 | 4,846 | 5,193 | 5,268 | 5,422 | 5,370 | 5,213 | 5,049 | ||||||||||||||||||||||||||||||
| Total deposit accounts | 27,790 | 28,303 | 28,912 | 32,616 | 33,692 | 30,760 | 33,963 | 32,866 | 32,502 | 31,385 | ||||||||||||||||||||||||||||||
| 7 |
Business
NorthWest Indiana Bancorp (the Bancorp) is a bank holding company registered with the Board of Governors of the Federal Reserve System. Peoples Bank (the Bank), an Indiana bank, is a wholly owned subsidiary of the Bancorp. The Bancorp has no other business activity other than being the holding company for the Bank.
The Bancorp conducts business from its Corporate Center in Munster and its twelve full-service offices located in Crown Point, Dyer, East Chicago, Gary, Hammond, Hobart, Merrillville, Munster, St. John, Schererville, and Valparaiso, Indiana. The Bancorp is primarily engaged in the business of attracting deposits from the general public and the origination of loans secured by single family residences and commercial real estate, as well as, construction loans, various types of consumer loans and commercial business loans, and loans to local municipalities. In addition, the Bancorp's Wealth Management Group provides estate and retirement planning, guardianships, land trusts, profit sharing and 401(k) retirement plans, IRA and Keogh accounts, and investment agency accounts. The Wealth Management Group may also serve as the personal representative of estates and act as trustee for revocable and irrevocable trusts.
The Bancorp's common stock is traded in the over-the-counter market and is quoted on the OTC Bulletin Board. On January 31, 2013, the Bancorp had 2,837,396 shares of common stock outstanding and 405 stockholders of record. This does not reflect the number of persons or entities who may hold their stock in nominee or "street" name through brokerage firms.
| 8 |
Management’s Discussion and Analysis of Financial Condition and Results of Operations |
General
The Bancorp's earnings are dependent upon the earnings of the Bank. The Bank's earnings are primarily dependent upon net interest margin. The net interest margin is the difference between interest income earned on loans and investments and interest expense paid on deposits and borrowings stated as a percentage of average interest earning assets. The net interest margin is perhaps the clearest indicator of a financial institution's ability to generate core earnings. Fees and service charges, wealth management operations income, gains and losses from the sale of assets, provisions for loan losses, income taxes and operating expenses also affect the Bancorp's profitability.
A summary of the Bancorp’s significant accounting policies is detailed in Note 1 to the Bancorp’s consolidated financial statements included in this report. The preparation of our financial statements requires management to make estimates and assumptions that affect our financial condition and operating results. Actual results could differ from those estimates. Estimates associated with the allowance for loan losses, fair values of foreclosed real estate, financial instruments and status of contingencies are particularly susceptible to material change in the near term as further information becomes available and future events occur.
At December 31, 2012, the Bancorp had total assets of $691.8 million and total deposits of $566.4 million. The Bancorp's deposit accounts are insured up to applicable limits by the Deposit Insurance Fund (DIF) that is administered by the Federal Deposit Insurance Corporation (FDIC), an agency of the federal government. At December 31, 2012, stockholders' equity totaled $67.7 million, with book value per share at $23.83. Net income for 2012 was $6.9 million, or $2.41 basic and diluted earnings per common share. The return on average assets was 1.02%, while the return on average stockholders’ equity was 10.27%.
Recent Developments
The Current Economic Environment. We continue to operate in a challenging and uncertain economic environment, including generally uncertain national conditions and local conditions in our markets. Overall economic growth continues to be slow and national and regional unemployment rates remain at elevated levels. The risks associated with our business remain acute in periods of slow economic growth and high unemployment. Moreover, many financial institutions continue to be affected by an uncertain real estate market. While we are continuing to take steps to decrease and limit our exposure to problem loans, we nonetheless retain direct exposure to the residential and commercial real estate markets, and we are affected by these events.
Our loan portfolio includes residential mortgage loans, construction loans, and commercial real estate loans. Declines in real estate values, home sales volumes and financial stress on borrowers as a result of the uncertain economic environment, including job losses, could have an adverse effect on our borrowers or their customers, which could adversely affect our financial condition and results of operations. In addition, the current level of low economic growth on a national scale, the occurrence of another national recession, or a deterioration in local economic conditions in our markets could drive loan losses beyond that which are provided for in our allowance for loan losses and result in the following other consequences: increases in loan delinquencies; problem assets and foreclosures may increase; demand for our products and services may decline; deposits may decrease, which would adversely impact our liquidity position; and collateral for our loans, especially real estate, may decline in value, in turn reducing customers’ borrowing power, and reducing the value of assets and collateral associated with our existing loans.
Impact of Legislation. Over the last four-and-a-half years, Congress and the U.S. Department of the Treasury have enacted legislation and taken actions to address the disruptions in the financial system, declines in the housing market, and the overall regulation of financial institutions and the financial system. In this regard, the 2010 Dodd-Frank Wall Street Reform and Consumer Protection Act (the “Dodd-Frank Act”), includes provisions affecting large and small financial institutions alike, including several provisions that profoundly affect the regulation of community banks, thrifts, and small bank and thrift holding companies, such as the Bancorp. Among other things, the Dodd-Frank Act abolished the Office of Thrift Supervision effective July 21, 2011 and transferred its functions to the Office of the Comptroller of the Currency (“OCC”), FDIC, and Federal Reserve. The Dodd-Frank Act also relaxes rules regarding interstate branching, allows financial institutions to pay interest on business checking accounts, changes the scope of federal deposit insurance coverage, imposes new capital requirements on bank and thrift holding companies, and imposes limits on debit card interchange fees charged by issuer banks (commonly known as the Durbin Amendment).
| 9 |
The Dodd-Frank Act also established the Consumer Financial Protection Bureau (the “CFPB”) within the Federal Reserve, which has broad authority to regulate consumer financial products and services and entities offering such products and services, including banks. Many of the consumer financial protection functions formerly assigned to the federal banking and other designated agencies are now performed by the CFPB. The CFPB has a large budget and staff, and has broad rulemaking authority over providers of credit, savings, and payment services and products. In this regard, the CFPB has the authority to implement regulations under federal consumer protection laws and enforce those laws against, and examine, financial institutions. State officials also will be authorized to enforce consumer protection rules issued by the CFPB. This bureau also is authorized to collect fines and provide consumer restitution in the event of violations, engage in consumer financial education, track consumer complaints, request data, and promote the availability of financial services to underserved consumers and communities. The CFPB also is directed to prevent “unfair, deceptive or abusive practices” and ensure that all consumers have access to markets for consumer financial products and services, and that such markets are fair, transparent, and competitive. Although the CFPB has begun to implement its regulatory, supervisory, examination, and enforcement authority, there continues to be significant uncertainty as to how the agency’s strategies and priorities will impact the Bancorp.
The CFPB has indicated that mortgage lending is an area of supervisory focus and that it will concentrate its examination and rulemaking efforts on the variety of mortgage-related topics required under the Dodd-Frank Act, including steering consumers to less-favorable products, discrimination, abusive or unfair lending practices, predatory lending, origination disclosures, minimum mortgage underwriting standards, mortgage loan originator compensation, and servicing practices. The CFPB recently published several final regulations impacting the mortgage industry, including rules related to ability-to-pay, mortgage servicing, and mortgage loan originator compensation. The ability-to-repay rule makes lenders liable if they fail to assess ability to repay under a prescribed test, but also creates a safe harbor for so called “qualified mortgages.” The “qualified mortgages” standards include a tiered cap structure that places limits on the total amount of certain fees that can be charged on a loan, a 43% cap on debt-to-income (i.e., total monthly payments on debt to monthly gross income), exclusion of interest-only products, and other requirements. The 43% debt-to-income cap does not apply for the first seven years the rule is in effect for loans that are eligible for sale to Fannie Mae or Freddie Mac or eligible for government guarantee through the FHA or the Veterans Administration. Failure to comply with the ability-to-repay rule may result in possible CFPB enforcement action and special statutory damages plus actual, class action, and attorneys fees damages, all of which a borrower may claim in defense of a foreclosure action at any time. The Bancorp’s management is currently assessing the impact of these requirements on our mortgage lending business.
In addition, the Federal Reserve and other federal bank regulatory agencies have issued a proposed rule under the Dodd-Frank Act that would exempt “qualified residential mortgages” from the securitization risk retention requirements of the Dodd-Frank Act. Although the Bancorp is primarily a portfolio lender, the final definition of what constitutes a “qualified residential mortgage” may impact the pricing and depth of the secondary market into which we may sell mortgages we originate. At this time, we cannot predict the content of final CFPB and other federal agency regulations or the impact they might have on the Bancorp’s financial results. The CFPB’s authority over mortgage lending, and its authority to change regulations adopted in the past by other regulators (i.e., regulations issued under the Truth in Lending Act, for example), or to rescind or ignore past regulatory guidance, could increase the Bancorp’s compliance costs and litigation exposure.
In addition to the CFPB’s authority over mortgage lending, the Dodd-Frank Act includes a series of provisions covering mortgage loan origination standards affecting, among other things, originator compensation, minimum repayment standards, and pre-payments. Moreover, the Dodd-Frank Act requires public companies like the Bancorp to hold shareholder advisory “say-on-pay” votes on executive compensation at least once every three years and submit related proposals to a vote of shareholders. The Bancorp will hold its first such “say-on-pay” vote at its 2013 annual meeting of shareholders. The Dodd-Frank Act contains numerous other provisions affecting financial institutions of all types, many of which may have an impact on the operating environment of the Bancorp in substantial and unpredictable ways. Consequently, the Dodd-Frank Act is expected to increase our cost of doing business, it may limit or expand our permissible activities, and it may affect the competitive balance within our industry and market areas. The Bancorp’s management continues to actively monitor the implementation of the Dodd-Frank Act and the regulations promulgated thereunder and assess its probable impact on the business, financial condition, and results of operations of the Bancorp. However, the ultimate effect of the Dodd-Frank Act on the financial services industry in general, and the Bancorp in particular, continues to be uncertain.
New Proposed Capital Rules. On June 7, 2012, the Federal Reserve approved proposed rules that would substantially amend the regulatory risk-based capital rules applicable to the Bancorp and the Bank. The FDIC and the OCC subsequently approved these proposed rules on June 12, 2012. The proposed rules implement the “Basel III” regulatory capital reforms and changes required by the Dodd-Frank Act. “Basel III” refers to two consultative documents released by the Basel Committee on Banking Supervision in December 2009, the rules text released in December 2010, and loss absorbency rules issued in January 2011, which include significant changes to bank capital, leverage and liquidity requirements. The proposed rules received extensive comments during a comment period that ran through October 2012. In November 2012, the federal ban regulatory agencies jointly stated that they do not expect any of the proposed rules to become effective on the original target date of January 1, 2013. Further guidance from the bank regulatory agencies is expected in early 2013.
| 10 |
The proposed rules include new risk-based capital and leverage ratios, which would be phased in from 2013 to 2019, and would refine the definition of what constitutes “capital” for purposes of calculating those ratios. The proposed new minimum capital level requirements applicable to the Bancorp and the Bank under the proposals would be: (i) a new common equity Tier 1 capital ratio of 4.5%; (ii) a Tier 1 capital ratio of 6% (increased from 4%); (iii) a total capital ratio of 8% (unchanged from current rules); and (iv) a Tier 1 leverage ratio of 4% for all institutions. The proposed rules would also establish a “capital conservation buffer” of 2.5% above the new regulatory minimum capital requirements, which must consist entirely of common equity Tier 1 capital and would result in the following minimum ratios: (i) a common equity Tier 1 capital ratio of 7.0%, (ii) a Tier 1 capital ratio of 8.5%, and (iii) a total capital ratio of 10.5%. The new capital conservation buffer requirement would be phased in beginning in January 2016 at 0.625% of risk-weighted assets and would increase by that amount each year until fully implemented in January 2019. An institution would be subject to limitations on paying dividends, engaging in share repurchases, and paying discretionary bonuses if its capital level falls below the buffer amount. These limitations would establish a maximum percentage of eligible retained income that could be utilized for such actions. Basel III provided discretion for regulators to impose an additional buffer, the “countercyclical buffer,” of up to 2.5% of common equity Tier 1 capital to take into account the macro-financial environment and periods of excessive credit growth. However, the proposed rules permit the countercyclical buffer to be applied only to “advanced approach banks” ( i.e. , banks with $250 billion or more in total assets or $10 billion or more in total foreign exposures), which currently excludes the Bancorp and the Bank. The proposed rules also implement revisions and clarifications consistent with Basel III regarding the various components of Tier 1 capital, including common equity, unrealized gains and losses, as well as certain instruments that will no longer qualify as Tier 1 capital, some of which would be phased out over time.
The federal bank regulatory agencies also proposed revisions to the prompt corrective action framework, which is designed to place restrictions on insured depository institutions, including the Bank, if their capital levels begin to show signs of weakness. These revisions would take effect January 1, 2015. Under the prompt corrective action requirements, which are designed to complement the capital conservation buffer, insured depository institutions would be required to meet the following increased capital level requirements in order to qualify as “well capitalized:” (i) a new common equity Tier 1 capital ratio of 6.5%; (ii) a Tier 1 capital ratio of 8% (increased from 6%); (iii) a total capital ratio of 10% (unchanged from current rules); and (iv) a Tier 1 leverage ratio of 5% (increased from 4%). The proposed rules set forth certain changes for the calculation of risk-weighted assets, which we would be required to utilize beginning January 1, 2015. The standardized approach proposed rule utilizes an increased number of credit risk exposure categories and risk weights, and also addresses: (i) a proposed alternative standard of creditworthiness consistent with Section 939A of the Dodd-Frank Act Act; (ii) revisions to recognition of credit risk mitigation; (iii) rules for risk weighting of equity exposures and past due loans; (iv) revised capital treatment for derivatives and repo-style transactions; and (v) disclosure requirements for top-tier banking organizations with $50 billion or more in total assets that are not subject to the “advance approach rules” that apply to banks with greater than $250 billion in consolidated assets.
Based on our current capital composition and levels, we believe that we would be in compliance with the requirements as set forth in the proposed rules if they were presently in effect.
Difficult Market Conditions Have Adversely Affected Our Industry. We are particularly exposed to downturns in the U.S. housing market. Dramatic declines in the housing market over the past five years, with falling home prices and increasing foreclosures, unemployment and under-employment, have negatively impacted the credit performance of mortgage and construction loans and securities and resulted in significant write-downs of asset values by financial institutions, including government-sponsored entities, major commercial and investment banks, and regional financial institutions. Reflecting concern about the stability of the financial markets generally and the strength of counterparties, many lenders and institutional investors have continued to observe tight lending standards, including with respect to other financial institutions, although there have been signs that lending is increasing. These market conditions have led to an increased level of commercial and consumer delinquencies, lack of consumer confidence, and increased market volatility. A worsening of these conditions would likely exacerbate the adverse effects of these difficult market conditions on the Bancorp and others in the financial institutions industry. In particular, the Bancorp may face the following risks in connection with these events:
| § | We are experiencing, and expect to continue experiencing increased regulation of our industry, particularly as a result of the Dodd-Frank Act and the CFPB. Compliance with such regulation is expected to increase our costs and may limit our ability to pursue business opportunities. |
| 11 |
| § | Our ability to assess the creditworthiness of our customers may be impaired if the models and approaches we use to select, manage and underwrite our customers become less predictive of future behaviors. |
| § | The process we use to estimate losses inherent in our credit exposure requires difficult, subjective and complex judgments, including forecasts of economic conditions and how these economic predictions might impair the ability of our borrowers to repay their loans, which may no longer be capable of accurate estimation which may, in turn, impact the reliability of the process. |
| § | Our ability to borrow from other financial institutions on favorable terms or at all could be adversely affected by disruptions in the capital markets or other events, including actions by rating agencies and deteriorating investor expectations. |
| § | Competition in our industry could intensify as a result of the increasing consolidation of financial services companies in connection with current market conditions. |
| § | We may be required to pay significantly higher deposit insurance premiums because market developments have significantly depleted the insurance fund of the Federal Deposit Insurance Corporation (FDIC) and reduced the ratio of reserves to insured deposits. |
In addition, the Federal Reserve Bank has been injecting vast amounts of liquidity into the banking system to compensate for weaknesses in short-term borrowing markets and other capital markets. A reduction in the Federal Reserve’s activities or capacity could reduce liquidity in the markets, thereby increasing funding costs to the Bancorp or reducing the availability of funds to the Bancorp to finance its existing operations.
Concentrations of Real Estate Loans Subjects the Bancorp to Increased Risks. A significant portion of the Bancorp’s loan portfolio is secured by real estate. The real estate collateral in each case provides an alternate source of repayment in the event of default by the borrower and may deteriorate in value during the time the credit is extended. While real estate values in almost all regions of the country, including the Midwest, have shown signs of stabilizing, the overall real estate market on a national level continues to show relative weakness. A further weakening of the real estate market could result in an increase in the number of borrowers who default on their loans and a reduction in the value of the collateral securing their loans, which in turn could have an adverse effect on our profitability and asset quality. If we are required to liquidate the collateral securing a loan to satisfy the debt during a period of reduced real estate values, our earnings and capital could be adversely affected.
Financial Condition
During the year ended December 31, 2012, total assets increased by $40.1 million (6.2%), to $691.9 million, with interest-earning assets increasing by $45.2 million (7.4%). At December 31, 2012, interest-earning assets totaled $653.1 million and represented 94.4% of total assets. Loans totaled $437.3 million and represented 67.0% of interest-earning assets, 63.2% of total assets and 77.2% of total deposits. The loan portfolio, which is the Bancorp’s largest asset, is a significant source of both interest and fee income. The Bancorp’s lending strategy emphasizes quality growth, product diversification, and competitive and profitable pricing. The loan portfolio includes $154.9 million (35.4%) in residential real estate loans, $148.2 million (33.9%) in commercial real estate loans, $69.3 million (15.9%) in commercial business loans, $31.7 million (7.2%) in multifamily loans, $24.0 million (5.5%) in construction and land development loans, $8.9 million (2.0%) in government and other loans, and $347 thousand (0.1%) in consumer loans. Adjustable rate loans comprised 57.2% of total loans at year-end. During 2012, loan balances increased by $35.9 million (8.9%), with multifamily, commercial real estate, commercial business, residential real estate loans, construction and development, and government balances increasing while consumer balances decreased. The increase in loans during the year is the result of improving credit and economic conditions.
The Bancorp is primarily a portfolio lender. Mortgage banking activities historically have been limited to the sale of fixed rate mortgage loans with contractual maturities greater than 15 years. However, during 2012, as a result of the low interest rate environment, management began selling some newly originated fixed rate mortgage loans with contractual maturities greater than 10 years in an effort to reduce interest rate risk. These loans are identified as held for sale when originated and sold, on a loan-by-loan basis, in the secondary market. During 2012, the Bancorp sold $26.4 million in newly originated fixed rate mortgage loans, compared to $10.6 million during 2011. Net gains realized from the mortgage loan sales totaled $804 thousand for 2012, compared to $256 thousand for 2011. Also, during the second quarter of 2012, the Bancorp conducted a $3.4 million one-time sale of portfolio fixed rate mortgage loans, which the Bancorp’s management considers an interest rate risk mitigation strategy to reduce loan prepayment risk. The segment of loans that were sold had a higher premium value and was projected to prepay significantly faster than the mortgage portfolio's average repayment speed. The gain realized from the prepayment risk reduction strategy totaled $183 thousand and was recorded during the second quarter of 2012. The proceeds from the loan sale were used to fund loans with longer durations and similar yields to the loans that were included in the sales strategy. At December 31, 2012, the Bancorp had $323 thousand in loans that were classified as held for sale.
| 12 |
The allowance for loan losses (ALL) is a valuation allowance for probable incurred credit losses, increased by the provision for loan losses, and decreased by charge-offs net of recoveries. A loan is charged off against the allowance by management as a loss when deemed uncollectible, although collection efforts continue and future recoveries may occur. The determination of the amounts of the ALL and provisions for loan losses is based on management’s current judgments about the credit quality of the loan portfolio with consideration given to all known relevant internal and external factors that affect loan collectability as of the reporting date. The appropriateness of the current period provision and the overall adequacy of the ALL are determined through a disciplined and consistently applied quarterly process that reviews the Bancorp’s current credit risk within the loan portfolio and identifies the required allowance for loan losses given the current risk estimates.
Historically, the Bancorp has successfully originated commercial real estate loans within its primary lending area. However, beginning in the fourth quarter of 2005, in response to a decrease in local loan demand and in an effort to reduce the potential credit risk associated with geographic concentrations, a strategy was implemented to purchase commercial real estate participation loans outside of the Bancorp’s primary lending area. The strategy to purchase these commercial real estate participation loans was limited to 10% of the Bancorp’s loan portfolio. The Bancorp’s management discontinued the out of market strategy during the third quarter of 2007. As of December 31, 2012, the Bancorp’s commercial real estate participation loan portfolio carried an aggregate balance of $28.0 million, of which $18.0 million has been purchased within the Bancorp’s primary lending area and $10.0 million outside of the primary lending area. At December 31, 2012, $5.4 million, or 19.3%, of the Bancorp’s commercial real estate participation loans have been internally classified as substandard and have been placed on non-accrual status. All $5.4 million in substandard commercial real estate participation loans placed on non-accrual status are located outside of the Bancorp’s primary lending area. The discussion in the paragraphs that follow regarding non-performing loans, internally classified loans and impaired loans includes loans from the Bancorp’s commercial real estate participation loan portfolio.
For all of its commercial real estate participation loans, consistent with current regulatory guidelines the Bancorp’s management requires that the lead lenders obtain external appraisals to determine the fair value of the underlying collateral for any collateral dependent loans. The Bancorp’s management requires current external appraisals when entering into a new lending relationship or when events have occurred that materially change the assumptions in the existing appraisal. The lead lenders receive external appraisals from qualified appraisal firms that have expertise in valuing commercial properties and are able to comply with the required scope of the engagement. After the lead lender receives the external appraisal and performs its compliance review, the appraisal is forwarded to the Bancorp for review. The Bancorp’s management validates the external appraisal by conducting an internal in-house review by personnel with expertise in commercial real estate developments. If additional expertise is needed, an independent review appraiser is hired to assist in the evaluation of the appraisal. The Bancorp is not aware of any significant time lapses during this process. Periodically, the Bancorp’s management may make adjustments to the external appraisal assumptions if additional known quantifiable data becomes available that materially impacts the value of a project. Examples of adjustments that may occur are changes in property tax assumptions or changes in capitalization rates. The Bancorp’s management relies on up-to-date external appraisals to determine the current value of its impaired commercial real estate participation loans. These values are appropriately adjusted to reflect changes in market value and, when necessary, is the basis for establishing the appropriate allowance for loan losses (ALL). If an updated external appraisal for a commercial real estate participation loan is received after the balance sheet date, but before the annual or quarterly financial statements are issued, material changes in appraised values are “pushed back” in the yet to be issued financial statements in order that appropriate loan loss provision is recorded for the current reporting period. The Bancorp’s management consistently records loan charge-offs based on the fair value or income approach of the collateral as presented in the current external appraisal.
| 13 |
Non-performing loans include those loans that are 90 days or more past due and those loans that have been placed on non-accrual status. Non-performing loans totaled $11.5 million at December 31, 2012, compared to $14.3 million at December 31, 2011, a decrease of $2.8 million or 19.6%. The ratio of non-performing loans to total loans was 2.63% at December 31, 2012, compared to 3.56% at December 31, 2011. The ratio of non-performing loans to total assets was 1.66% at December 31, 2012, compared to 2.19% at December 31, 2011. The decrease in non-performing loans for 2012 is related to loans moving off of non-accrual status, pay downs and charge-offs. At December 31, 2012, all non-performing loans are also accounted for on a non accrual basis, except for one loan totaling $229 thousand that was classified as accruing and 90 days past due. The current level of non-performing loans is concentrated in two previously reported out of market commercial real estate participation loans totaling $5.4 million in the aggregate. Both of the non-performing commercial real estate participation loans are hotel loans that have been charged down to their fair value based on the current fair value of the respective project’s collateral, less estimated selling costs. For these commercial real estate participation loans, to the extent that actual cash flows, collateral values and strength of personal guarantees differ from current estimates, additional provisions to the allowance for loan losses may be required.
Loans, internally classified as substandard, totaled $19.7 million at December 31, 2012, compared to $24.6 million at December 31, 2011 a decrease of $4.9 million or 19.9%. The current level of substandard loans is concentrated in the previously mentioned two non-performing commercial real estate participation loans and one accruing commercial real estate hotel loan in the amount of $4.9 million, which is the largest loan in this group. Substandard loans include non-performing loans and potential problem loans, where information about possible credit issues or other conditions causes management to question the ability of such borrowers to comply with loan covenants or repayment terms. No loans were internally classified as doubtful or loss at December 31, 2012 or December 31, 2011. In addition to identifying and monitoring non-performing and other classified loans, management maintains a list of watch loans. Watch loans represent loans management is closely monitoring due to one or more factors that may cause the loan to become classified as substandard. Watch loans totaled $17.7 million at December 31, 2012, compared to $16.6 million at December 31, 2011 an increase of $1.1 million or 6.6%. The increase in watch loans is related to the upgrading of one commercial real estate participation loan totaling $935 thousand, which had been previously classified as substandard.
A loan is considered impaired when, based on current information and events, it is probable that a borrower will be unable to pay all amounts due according to the contractual terms of the loan agreement. At December 31, 2012, impaired loans totaled $19.9 million, compared to $21.7 million at December 31, 2011 a decrease of $1.8 million or 8.3%. The December 31, 2012, impaired loan balances consist of twenty-six commercial real estate and commercial business loans totaling $19.2 million that are secured by business assets and real estate, and are personally guaranteed by the owners of the businesses. In addition, seven mortgage loans totaling $692 thousand, which are troubled debt restructurings have also been classified as impaired. The December 31, 2012 ALL contained $2.0 million in specific allowances for collateral deficiencies, compared to $1.6 million at December 31, 2011. During the fourth quarter of 2012, two commercial business loans totaling $435 thousand were newly classified as impaired. There were no other loans considered to be impaired loans as of December 31, 2012. Typically, management does not individually classify smaller-balance homogeneous loans, such as residential mortgages or consumer loans, as impaired, unless they are troubled debt restructurings.
At December 31, 2012, the Bancorp classified fifteen loans totaling $15.1 million as troubled debt restructurings, which involves modifying the terms of a loan to forego a portion of interest or principal or reducing the interest rate on the loan to a rate materially less than market rates, or materially extending the maturity date of a loan. The Bancorp’s troubled debt restructurings include two commercial real estate participation hotel loans in the amount of $5.6 million and one commercial real estate hotel loan in the amount of $4.9 million, for which significant deferrals of principal repayments were granted; one commercial real estate loan in the amount of $2.4 million for which a significant deferral of principal and interest repayment was granted; one commercial real estate loan in the amount of $547 thousand for which a significant deferral of principal and interest repayment was granted by the Bank as required by a bankruptcy plan; two development loans in the amount of $893 thousand for which an interest rate concession was granted; and one commercial business loan in the amount of $88 thousand and seven mortgage loans totaling $692 thousand, for which maturity dates were materially extended. At December 31, 2012, $9.7 million of the Bancorp’s loans classified as troubled debt restructurings are accruing loans. The valuation basis for the Bancorp’s troubled debt restructurings is based on the present value of cash flows, unless consistent cash flows are not present, then the fair value of the collateral securing the loan is the basis for valuation.
At December 31, 2012, management is of the opinion that there are no loans, except those discussed above, where known information about possible credit problems of borrowers causes management to have serious doubts as to the ability of such borrowers to comply with the present loan repayment terms and which will imminently result in such loans being classified as past due, non-accrual or a troubled debt restructure. Management does not presently anticipate that any of the non-performing loans or classified loans would materially impact future operations, liquidity or capital resources.
For 2012, $2.4 million in provisions to the ALL were required, compared to $3.5 million for 2011 a decrease of $1.1 million or 31.4%. The ALL provision decrease for 2012 is primarily a result of improved asset quality. The current year ALL provisions were primarily related to the current credit risk in the commercial real estate loan portfolio and 2012 loan originations. For 2012, charge-offs, net of recoveries, totaled $1.9 million, compared to $4.6 million for 2011. The net loan charge-offs for 2012 were comprised of $765 thousand in commercial real estate participation loans, $582 thousand in commercial business loans, $243 thousand in commercial real estate loans, $332 thousand in residential real estate loans, and $12 thousand in consumer loans. The ALL provisions take into consideration management’s current judgments about the credit quality of the loan portfolio, loan portfolio balances, changes in the portfolio mix and local economic conditions. In determining the provision for loan losses for the current period, management has given consideration to historically elevated risks associated with the local economy, changes in loan balances and mix, and asset quality.
| 14 |
The ALL to total loans was 1.93% at December 31, 2012, compared to 1.99% at December 31, 2011. The ALL to non-performing loans (coverage ratio) was 73.34% at December 31, 2012, compared to 56.03% at December 31, 2011. The December 31, 2012 balance in the ALL account of $8.4 million is considered adequate by management after evaluation of the loan portfolio, past experience and current economic and market conditions. While management may periodically allocate portions of the allowance for specific problem loans, the whole allowance is available for any loan charge offs that occur. The allocation of the ALL reflects performance and growth trends within the various loan categories, as well as consideration of the facts and circumstances that affect the repayment of individual loans, and loans which have been pooled as of the evaluation date, with particular attention given to non-performing loans and loans which have been classified as substandard, doubtful or loss. Management has allocated reserves to both performing and non-performing loans based on current information available.
At December 31, 2012, foreclosed real estate totaled $425 thousand, which was comprised of ten properties, compared to $2.5 million and eleven properties at December 31, 2011. During 2012, loans totaling $1.6 million were transferred into foreclosed real estate, while net sales of foreclosed real estate totaled $3.8 million. Net gains from the 2012 sales totaled $430 thousand. At the end of December 2012 all of the Bancorp’s foreclosed real estate is located within its primary market area.
At December 31, 2012, the Bancorp's investment portfolio totaled $187.5 million and was invested as follows: 53.4% in U.S. government agency mortgage-backed securities and collateralized mortgage obligations, 33.6% in municipal securities, 12.3% in U.S. government agency debt securities, and 0.7% in trust preferred securities. During 2011, management transferred its entire held-to-maturity securities portfolio to available-for-sale in order to provide management with the ability to sell lower balance odd lot securities, divest of certain securities to reduce credit or interest rate risk within the portfolio, and be positioned to take advantage of other portfolio restructuring opportunities. Available-for-sale securities are those the Bancorp may decide to sell if needed for liquidity, asset-liability management or other reasons. The book value of the securities transferred totaled $16.4 million, with an unrealized gain of $1.0 million that was recorded as a component of other comprehensive income at the date of transfer. During 2012, securities increased by $513 thousand (0.3%). In addition, at December 31, 2012, the Bancorp had $3.1 million in FHLB stock.
As of December 31, 2012, three of the Bancorp’s four investments in trust preferred securities are in “payment in kind” status. Payment in kind status results in a temporary delay in the payment of interest. As a result of a delay in the collection of the interest payments, management placed these securities on non-accrual status. At December 31, 2012, the cost basis of the three trust preferred securities on non-accrual status totaled $3.9 million. Current estimates indicate that the interest payment delays may exceed ten years. One trust preferred security with a cost basis of $1.3 million remains on accrual status.
Deposits are a fundamental and cost-effective source of funds for lending and other investment purposes. The Bancorp offers a variety of products designed to attract and retain customers, with the primary focus on building and expanding relationships. At December 31, 2012, deposits totaled $566.4 million. During 2012, deposits increased by $39.5 million (7.5%). The 2012 change in deposits was comprised of the following: certificates of deposit decreased by $5.3 million (3.0%), checking accounts increased by $35.2 million (22.3%), savings accounts increased by $6.2 million (8.7%), and money market deposit accounts (MMDA’s) increased by $3.4 million (2.8%). During 2012, management continues to allow higher cost certificates of deposit to mature while relying on funding from checking, MMDA, and savings deposits. The increase in checking, savings, and MMDA balances is a result of customer preferences for liquid investments in the current low interest rate environment.
The Bancorp’s borrowed funds are primarily comprised of repurchase agreements and FHLB advances that are used to fund asset growth not supported by deposit generation. At December 31, 2012, borrowed funds totaled $49.5 million compared to $52.0 million at December 31, 2011, a decrease of $2.5 million (4.8%). During 2012, management reduced borrowed funds with an average rate of 1.32%, while relying more on low cost core deposits for funding. Retail repurchase agreements totaled $16.3 million at December 31, 2012, compared to $15.4 million at December 31, 2011, an increase of $903 thousand (5.9%). FHLB advances totaled $33.0 million, decreasing $3.0 million or 8.3%. The Bancorp’s FHLB line of credit carried a zero balance at December 31, 2012 and 2011. Other short-term borrowings totaled $207 thousand at December 31, 2012, compared to $618 thousand at December 31, 2011.
| 15 |
Liquidity and Capital Resources
The Bancorp’s primary goals for funds and liquidity management are to generate sufficient cash to fund current loan demand, meet deposit withdrawals, and pay dividends and operating expenses. Because profit and liquidity are often conflicting objectives, management attempts to maximize the Bank’s net interest margin by making adequate, but not excessive, liquidity provisions. Furthermore, funds are managed so that future profits will not be significantly impacted as funding costs increase.
Changes in the liquidity position result from operating, investing and financing activities. Cash flows from operating activities are generally the cash effects of transactions and other events that enter into the determination of net income. The primary investing activities include loan originations, loan repayments, investments in interest bearing balances in financial institutions, and the purchase, sale, and maturity of investment securities. Financing activities focus almost entirely on the generation of customer deposits. In addition, the Bancorp utilizes borrowings (i.e., repurchase agreements, FHLB advances and federal funds purchased) as a source of funds.
During 2012, cash and cash equivalents increased $7.4 million compared to an increase of $15.4 million for 2011. During 2012, the primary sources of cash and cash equivalents were from maturities and sales of securities, deposit originations, loan sales and repayments, an FHLB advance, and cash from operating activities. The primary uses of cash and cash equivalents were loan originations, purchase of securities, expenditures for premises and equipment, FHLB advance repayments, and the payment of common stock dividends. During 2012, cash from operating activities totaled $8.5 million, compared to $14.8 million for 2011. The 2012 decrease in cash provided by operating activities was primarily a result of timing differences of customer ACH deposit activity. Cash outflows from investing activities totaled $36.3 million during 2012, compared to outflows of $7.9 million during 2011. The changes for the current year were related to increased loan originations, the purchase of loan participations, purchases of securities, and increased investment in premises and equipment as detailed in the notes to the financial statements. Net cash inflows from financing activities totaled $35.2 million in 2012, compared to net cash inflows of $8.4 million in 2011. The change during 2012 was primarily due to an increase in deposits and other borrowed funds as detailed in the notes to the financial statements. The Bancorp paid dividends on common stock on a cash basis of $1.9 million and $1.7 million during 2012 and 2011, respectively. During 2012, the Bancorp’s Board of Directors increased dividends as earnings and capital improved.
Management strongly believes that safety and soundness is enhanced by maintaining a high level of capital. Stockholders' equity totaled $67.7 million at December 31, 2012, compared to $63.0 million at December 31, 2011, an increase of $4.7 million (7.5%). The increase was primarily the result of $6.9 million in net income for 2012. Additional items increasing stockholders' equity was $141 thousand from the sale of treasury stock, and $16 thousand from stock-based compensation plans. Decreasing stockholders' equity were the Bancorp’s declaration of $2.0 million in cash dividends, and $197 thousand from the change in other comprehensive income. At December 31, 2012, book value per share was $23.83 compared to $22.20 for 2011.
The Bancorp is subject to risk-based capital guidelines adopted by the Board of Governors of the Federal Reserve System (the FRB), and the Bank is subject to risk-based capital guidelines adopted by the FDIC. As applied to the Bancorp and the Bank, the FRB and FDIC capital requirements are substantially the same. These regulations divide capital into two tiers. The first tier (Tier 1) includes common equity, certain non-cumulative perpetual preferred stock and minority interests in equity accounts of consolidated subsidiaries, less goodwill and certain other intangible assets. Supplementary (Tier 2) capital includes, among other things, cumulative perpetual and long-term limited-life preferred stock, mandatory convertible securities, certain hybrid capital instruments, term subordinated debt and the allowance for loan losses, subject to certain limitations, less required deductions. The Bancorp and the Bank are required to maintain a total risk-based capital ratio of 8%, of which 4% must be Tier 1 capital. In addition, the FRB and FDIC regulations provide for a minimum Tier 1 leverage ratio (Tier 1 capital to adjusted average assets) of 3% for financial institutions that meet certain specified criteria, including that they have the highest regulatory rating and are not experiencing or anticipating significant growth. All other financial institutions are required to maintain a Tier 1 leverage ratio of 3% plus an additional cushion of at least one to two percent.
The following table shows that, at December 31, 2012, the Bancorp’s capital exceeded all regulatory capital requirements. At December 31, 2012, the Bancorp’s and the Bank’s regulatory capital ratios were substantially the same. The dollar amounts are in millions.
| Minimum | ||||||||||||||||||||||||
| Required To Be | ||||||||||||||||||||||||
| Well Capitalized | ||||||||||||||||||||||||
| Minimum Required | Under Prompt | |||||||||||||||||||||||
| For Capital | Corrective | |||||||||||||||||||||||
| At December 31, 2012 | Actual | Adequacy Purposes | Action Regulations | |||||||||||||||||||||
| Amount | Ratio | Amount | Ratio | Amount | Ratio | |||||||||||||||||||
| Total capital to risk-weighted assets | $ | 70.1 | 14.6 | % | $ | 38.3 | 8.0 | % | $ | 47.9 | 10.0 | % | ||||||||||||
| Tier 1 capital to risk-weighted assets | $ | 64.1 | 13.4 | % | $ | 19.1 | 4.0 | % | $ | 28.7 | 6.0 | % | ||||||||||||
| Tier 1 capital to adjusted average assets | $ | 64.1 | 9.4 | % | $ | 20.5 | 3.0 | % | $ | 34.2 | 5.0 | % | ||||||||||||
| 16 |
The Bancorp’s ability to pay dividends to its shareholders is entirely dependent upon the Bank’s ability to pay dividends to the Bancorp. Under Indiana law, the Bank may pay dividends from its undivided profits (generally, earnings less losses, bad debts, taxes and other operating expenses) as is considered expedient by the Bank’s Board of Directors. However, the Bank must obtain the approval of the Indiana Department of Financial Institutions (DFI) for the payment of a dividend if the total of all dividends declared by the Bank during the current year, including the proposed dividend, would exceed the sum of retained net income for the year to date plus its retained net income for the previous two years. For this purpose, “retained net income,” means net income as calculated for call report purposes, less all dividends declared for the applicable period. The aggregate amount of dividends that may be declared by the Bank in 2013, with prior DFI approval is $8.7 million plus 2013 net profits. Moreover, the FDIC and the Federal Reserve Board may prohibit the payment of dividends if it determines that the payment of dividends would constitute an unsafe or unsound practice in light of the financial condition of the Bank. On November 30, 2012, the Board of Directors of the Bancorp declared a fourth quarter dividend of $0.19 per share. The Bancorp’s fourth quarter dividend was paid to shareholders on January 4, 2013.
Results of Operations – Comparison of 2012 to 2011
Net income for 2012 was $6.9 million, compared to $5.4 million for 2011, an increase of $1.5 million (27.3%). The increase in net income for 2012 was the result of lower interest expense, lower required provisions for loan losses, and higher noninterest income. The earnings represent a return on average assets of 1.02% for 2012 compared to 0.84% for 2011. The return on average equity was 10.27% for 2012 compared to 8.90% for 2011.
Net interest income for 2012 was $23.7 million, a decrease of $28 thousand (0.1%) from $23.8 million for 2011. During the year, the Bancorp’s cost of funds continued to be positively impacted by the Federal Reserve’s actions in maintaining a low short-term interest rate environment, however, the Bancorp’s yield on interest earning assets is being negatively impacted by lower long-term interest rates. The weighted-average yield on interest-earning assets was 4.14% for 2012 compared to 4.49% for 2011. The weighted-average cost of funds was 0.39% for 2012 compared to 0.56% for 2011. The impact of the 4.14% return on interest earning assets and the 0.39% cost of funds resulted in a net interest spread of 3.75% for 2012 compared to 3.93% for 2011. During 2012, total interest income decreased by $911 thousand (3.4%) while total interest expense decreased by $883 thousand (27.3%). The net interest margin was 3.77% for 2012 compared to 3.96% for 2011. The Bancorp’s tax equivalent net interest margin for 2012 was 3.96% compared to 4.17% for 2011.
During 2012, interest income from loans decreased by $228 thousand (1.1%) compared to 2011. The change was primarily due to a decrease in the weighted-average yield of the loan portfolio. The weighted-average yield on loans outstanding was 4.88% for 2012 compared to 5.10% for 2011. Loan balances averaged $423.6 million for 2012, an increase of $13.8 million (3.4%) from $409.8 million for 2011. During 2012, interest income from securities and other interest earning assets decreased by $683 thousand (11.2%) compared to 2011. The decrease was due to a decrease in the weighted average yield. The weighted-average yield on securities and other interest earning assets was 2.62% for 2012 compared to 3.20% for 2011. Securities and other interest earning assets averaged $206.3 million for 2012, up $15.6 million (8.2%) from $190.7 million for 2011.
Interest expense for deposits decreased by $898 thousand (36.3%) during 2012 compared to 2011. The change was due to a decrease in the weighted-average rate paid on deposits. The weighted-average rate paid on deposits for 2012 was 0.29% compared to 0.47% for 2011. Total deposit balances averaged $538.6 million for 2012, an increase of $12.6 million (2.4%) from $526.0 million for 2011. Interest expense for borrowed funds increased by $15 thousand (2.0%) during 2012 compared to 2011. The change was due to higher average balances. The weighted-average cost of borrowed funds was 1.32% for 2012 compared to 1.50% for 2011. Borrowed funds averaged $58.7 million during 2012, an increase of $8.2 million (16.2%) from $50.5 million for 2011.
Noninterest income for 2012 was $7.5 million, an increase of $1.3 million (20.6%) from $6.2 million for 2011. During 2012, fees and service charges totaled $2.7 million, an increase of $176 thousand (7.0%) from $2.5 million for 2011. The increase was the result of a concentrated effort made during the year to assess the competiveness of deposit fee and service charges in addition to additional fees related to loan activities. Fees from Wealth Management operations totaled $1.3 million for 2012, an increase of $87 thousand (7.4%) from $1.2 million for 2011. The increase in Wealth Management income is related to growth in assets under management and market value changes. Gains from the sale of securities totaled $1.1 million for the current year, an increase of $154 thousand (15.9%) from $1.0 million for 2011. Current market conditions continue to provide opportunities to manage securities cash flows, while recognizing gains from the sales of securities. Gains from loan sales totaled $987 thousand for the current year, an increase of $731 thousand (285.5%), compared to $256 thousand for 2011. The increase in gains from the sale of loans is a result of increased customer refinance activity to low rate fixed rate mortgages as well as a sale of seasoned fixed rate mortgages with high prepayment speeds, which resulted in a one-time gain of $183 thousand. Due to the passing of a senior manager during the third quarter, the Bancorp received a $587 thousand benefit from bank owned life insurance. For 2012, foreclosed real estate sales gains totaled $430 thousand, a decrease of $457 thousand (51.5%) from gains of $887 thousand for 2011. The decrease is partly related to the Bancorp’s favorable settlement in its lawsuit against the lead lender of a commercial real estate participation loan in 2011. Income from the increase in the cash value of bank owned life insurance totaled $381 thousand for 2012, a decrease of $17 thousand (4.3%), compared to $398 thousand for 2011. During 2012, other-than-temporary impairment of $6 thousand was recognized compared to $1 thousand of impairment recognized during 2011. During 2012, other noninterest income totaled $96 thousand, an increase of $33 thousand (52.4%) from $63 thousand for 2011.
| 17 |
Noninterest expense for 2012 was $20.1 million, up $191 thousand (1.0%) from $19.9 million for 2011. During 2012, compensation and benefits totaled $10.8 million, an increase of $830 thousand (8.3%) from $10.0 million for 2011. The increase in compensation and benefits is the result of additional benefit accruals related to the Bancorp’s strong operating performance. Occupancy and equipment expense totaled $3.1 million for 2012, a decrease of $269 thousand (8.1%) compared to $3.3 million for 2011. The decrease in occupancy and equipment expense is the result of lower required depreciation expense and building repair and maintenance expenses. Data processing expense totaled $1.1 million for 2012, an increase of $68 thousand (6.8%) from $1.0 million for 2011. The change is a result of increased utilization of internal systems. Federal deposit insurance premiums totaled $571 thousand for 2012, a decrease of $375 thousand (39.6%) from $946 thousand for 2011. The decrease was the result of lower FDIC assessment rates. Marketing expense related to banking products totaled $380 thousand for the year, a decrease of $23 thousand (5.7%) from $403 thousand for 2011. Statement and check processing expense totaled $317 thousand for the year, a decrease of $12 thousand (3.6%) from $329 thousand for 2011. Professional service expense totaled $279 thousand for the year, a decrease of $150 thousand (35.0%) from $429 thousand for 2011. The decrease in professional services is primarily related to lower legal expense, which was the result of the Bancorp being a party to less litigation during 2012. Other expenses related to banking operations totaled $3.7 million for 2012, an increase of $122 thousand (3.5%) from $3.5 million for 2011. The Bancorp’s efficiency ratio for 2012 was 64.36% compared to 66.42% for 2011. The improvement is the result of higher total noninterest income. The ratio is determined by dividing total noninterest expense by the sum of net interest income and total noninterest income for the period.
The Bancorp had an income tax expense for 2012 of $1.9 million compared to income tax expense of $1.2 million for 2011, an increase to expense of $762 thousand (64.6%). The combined effective federal and state tax rates for the Bancorp were 22.0% for 2012 and 18.0% for 2011. The current year’s higher effective tax rate is the result of higher taxable income as a percentage of total income. The Bancorp’s current lower effective tax rate relative to federal and state statutory rates is a result of continued tax strategies associated with the Bancorp’s tax-exempt investments and loans, bank owned life insurance, and real estate investment trust, all of which reduce the effective tax rate. Details of deferred and current tax items can be found in Note 6 – Income Taxes.
Critical Accounting Policies
Critical accounting policies are those accounting policies that management believes are most important to the portrayal of the Bancorp’s financial condition and that require management’s most difficult, subjective or complex judgments. The Bancorp’s most critical accounting policies are summarized below. Other accounting policies, including those related to the fair values of financial instruments and the status of contingencies, are summarized in Note 1 to the Bancorp’s consolidated financial statements.
Valuation of Investment Securities – The fair values of securities available for sale are determined on a recurring basis by obtaining quoted prices on nationally recognized securities exchanges or pricing models utilizing significant observable inputs such as matrix pricing, which is a mathematical technique widely used in the industry to value debt securities without relying exclusively on quoted prices for the specific securities but rather by relying on the securities’ relationship to other benchmark quoted securities. Different judgments and assumptions used in pricing could result in different estimates of value. In certain cases where market data is not readily available because of lack of market activity or little public disclosure, values may be based on unobservable inputs and classified in Level 3 of the fair value hierarchy.
At the end of each reporting period securities held in the investment portfolio are evaluated on an individual security level for other-than-temporary impairment in accordance with the Investments – Debt and Equity Securities Topic of the Accounting Standards Codification. Significant judgments are required in determining impairment, which include making assumptions regarding the estimated prepayments, loss assumptions and the change in interest rates.
We consider the following factors when determining an other-than-temporary impairment for a security: The length of time and the extent to which the market value has been less than amortized cost; the financial condition and near-term prospects of the issuer; the underlying fundamentals of the relevant market and the outlook for such market for the near future; and an assessment of whether the Bancorp has (1) the intent to sell the debt securities or (2) more likely than not will be required to sell the debt securities before its anticipated market recovery. If either of these conditions is met, management will recognize other-than-temporary impairment. If, in management’s judgment, an other-than-temporary impairment exists, the cost basis of the security will be written down for the credit loss, and the unrealized loss will be transferred from accumulated other comprehensive loss as an immediate reduction of current earnings. Management will utilize an independent valuation specialist to value securities for other-than-temporary impairment.
| 18 |
Allowance for Loan Losses – The Bancorp maintains an Allowance for Loan Losses (ALL) to absorb probable incurred credit losses that arise from the loan portfolio. The ALL is increased by the provision for loan losses, and decreased by charge-offs net of recoveries. The determination of the amounts of the ALL and provisions for loan losses is based upon management’s current judgments about the credit quality of the loan portfolio with consideration given to all known relevant internal and external factors that affect loan collectability. The methodology used to determine the current year provision and the overall adequacy of the ALL includes a disciplined and consistently applied quarterly process that combines a review of the current position with a risk assessment worksheet. Factors that are taken into consideration in the analysis include an assessment of national and local economic trends, a review of current year loan portfolio growth and changes in portfolio mix, and an assessment of trends for loan delinquencies and loan charge-off activity. Particular attention is given to non-accruing loans and accruing loans past due 90 days or more, and loans that have been classified as substandard, doubtful, or loss. Changes in the provision are directionally consistent with changes in observable data.
Commercial and industrial, and commercial real estate loans that exhibit credit weaknesses and loans that have been classified as impaired are subject to an individual review. Where appropriate, ALL allocations are made to these loans based on management’s assessment of financial position, current cash flows, collateral values, financial strength of guarantors, industry trends, and economic conditions. ALL allocations for homogeneous loans, such as residential mortgage loans and consumer loans, are based on historical charge-off activity and current delinquency trends. Management has allocated general reserves to both performing and non-performing loans based on historical data and current information available.
Risk factors for non-performing and internally classified loans are based on an analysis of either the projected discounted cash flows or the estimated collateral liquidation value for individual loans defined as substandard or doubtful. Estimated collateral liquidation values are based on established loan underwriting standards and adjusted for current mitigating factors on a loan-by-loan basis. Aggregate substandard loan collateral deficiencies are determined for residential, commercial real estate, commercial business, and consumer loan portfolios. These deficiencies are then stated as a percentage of the total substandard balances to determine the appropriate risk factors.
Risk factors for performing and non-classified loans are based on a weighted average of net charge-offs for the most recent three years, which are then stated as a percentage of average loans for the same period. Historical risk factors are calculated for residential, commercial real estate, commercial business, and consumer loans. The three year weighted average historical factors are then adjusted for current subjective risks attributable to: regional and national economic factors; loan growth and changes in loan composition; organizational structure; composition of loan staff; loan concentrations; policy changes and out of market lending activity.
The risk factors are applied to these types of loans to determine the appropriate level for the ALL. Adjustments may be made to these allocations that reflect management’s judgment on current conditions, delinquency trends, and charge-off activity. Based on the above discussion, management believes that the ALL is currently adequate, but not excessive, given the risk inherent in the loan portfolio.
Impact of Inflation and Changing Prices The financial statements and related data presented herein have been prepared in accordance with accounting principles generally accepted in the United States of America, which require the measurement of financial position and operating results in terms of historical dollars, without considering changes in the relative purchasing power of money over time due to inflation. The primary assets and liabilities of the Bancorp are monetary in nature. As a result, interest rates have a more significant impact on the Bancorp’s performance than the effects of general levels of inflation. Interest rates do not necessarily move in the same direction or magnitude as the prices of goods and services.
Forward-Looking Statements
Statements contained in this report that are not historical facts are forward-looking statements within the meaning of the Private Securities Litigation Reform Act of 1995. The words or phrases “would be,” “will allow,” “intends to,” “will likely result,” “are expected to,” “will continue,” “is anticipated,” “estimate,” “project,” or similar expressions are also intended to identify “forward-looking statements” within the meaning of the Private Securities Litigation Reform Act. The Bancorp cautions readers that forward-looking statements, including without limitation, those relating to the Bancorp’s future business prospects, interest income and expense, net income, liquidity, and capital needs are subject to certain risks and uncertainties that could cause actual results to differ materially from those indicated in the forward-looking statements, due to, among other things, factors identified in this report.
| 19 |
Report of Independent Registered Public Accounting Firm |
Board of Directors
NorthWest Indiana Bancorp and Subsidiary
Munster, Indiana
We have audited the accompanying consolidated balance sheets of NorthWest Indiana Bancorp and Subsidiary (the “Company”) as of December 31, 2012 and 2011, and the related consolidated statements of income, comprehensive income, changes in stockholders’ equity, and cash flows for the years then ended. The consolidated financial statements are the responsibility of the Company’s management. Our responsibility is to express an opinion on the consolidated financial statements based on our audits.
We conducted our audits in accordance with the standards of the Public Company Accounting Oversight Board (United States). Those standards require that we plan and perform the audits to obtain reasonable assurance about whether the consolidated financial statements are free of material misstatement. The Company is not required to have, nor were we engaged to perform, an audit of its internal control over financial reporting. Our audits included consideration of internal control over financial reporting as a basis for designing audit procedures that are appropriate in the circumstances, but not for the purpose of expressing an opinion on the effectiveness of the Company’s internal control over financial reporting. Accordingly we express no such opinion. An audit includes examining, on a test basis, evidence supporting the amounts and disclosures in the consolidated financial statements. An audit also includes assessing the accounting principles used and significant estimates made by management, as well as evaluating the overall consolidated financial statement presentation. We believe that our audits provide a reasonable basis for our opinion.
In our opinion, the consolidated financial statements referred to above present fairly, in all material respects, the consolidated financial position of NorthWest Indiana Bancorp and Subsidiary as of December 31, 2012 and 2011, and the consolidated results of their operations and cash flows for the years then ended in conformity with accounting principles generally accepted in the United States of America.
/s/ Plante & Moran, PLLC
Chicago, Illinois
February 15, 2013
| 20 |
Consolidated Balance Sheets
| December 31, | ||||||||
| (Dollars in thousands) | 2012 | 2011 | ||||||
| ASSETS | ||||||||
| Cash and non-interest bearing balances in financial institutions | $ | 8,512 | $ | 9,875 | ||||
| Interest bearing deposits in other financial institutions | 19,832 | 10,676 | ||||||
| Federal funds sold | 5,407 | 5,816 | ||||||
| Total cash and cash equivalents | 33,751 | 26,367 | ||||||
| Securities available-for-sale | 187,475 | 186,962 | ||||||
| Loans held-for-sale | 323 | 0 | ||||||
| Loans receivable | 436,981 | 401,401 | ||||||
| Less: allowance for loan losses | (8,421 | ) | (8,005 | ) | ||||
| Net loans receivable | 428,560 | 393,396 | ||||||
| Federal Home Loan Bank stock | 3,086 | 3,086 | ||||||
| Accrued interest receivable | 2,483 | 2,554 | ||||||
| Premises and equipment | 17,678 | 18,242 | ||||||
| Foreclosed real estate | 425 | 2,457 | ||||||
| Cash value of bank owned life insurance | 12,516 | 12,850 | ||||||
| Prepaid FDIC insurance premium | 991 | 1,523 | ||||||
| Other assets | 4,557 | 4,321 | ||||||
| Total assets | $ | 691,845 | $ | 651,758 | ||||
| LIABILITIES AND STOCKHOLDERS' EQUITY | ||||||||
| Deposits: | ||||||||
| Non-interest bearing | $ | 75,228 | $ | 55,577 | ||||
| Interest bearing | 491,181 | 471,304 | ||||||
| Total | 566,409 | 526,881 | ||||||
| Repurchase agreements | 16,298 | 15,395 | ||||||
| Borrowed funds | 33,207 | 36,618 | ||||||
| Accrued expenses and other liabilities | 8,280 | 9,904 | ||||||
| Total liabilities | 624,194 | 588,798 | ||||||
| Stockholders' Equity: | ||||||||
| Preferred stock, no par or stated value; 10,000,000 shares authorized, none outstanding | - | - | ||||||
| Common stock, no par or stated value; 10,000,000 shares
authorized; shares issued: December 31, 2012 - 2,888,902 | ||||||||
| December 31, 2011 - 2,888,902 | ||||||||
| shares outstanding: December 31, 2012 - 2,839,137 | ||||||||
| December 31, 2011 - 2,835,403 | 361 | 361 | ||||||
| Additional paid-in capital | 5,189 | 5,173 | ||||||
| Accumulated other comprehensive income | 2,339 | 2,536 | ||||||
| Retained earnings | 60,817 | 56,032 | ||||||
| Treasury stock, common shares at cost: December 31, 2012 - 49,765 | ||||||||
| December 31, 2011 - 53,499 | (1,055 | ) | (1,142 | ) | ||||
| Total stockholders' equity | 67,651 | 62,960 | ||||||
| Total liabilities and stockholders' equity | $ | 691,845 | $ | 651,758 | ||||
See accompanying notes to consolidated financial statements.
| 21 |
Consolidated Statements of Income
| (Dollars in thousands, except per share data) | Year Ended December 31, | |||||||
| 2012 | 2011 | |||||||
| Interest income: | ||||||||
| Loans receivable | ||||||||
| Real estate loans | $ | 17,168 | $ | 17,258 | ||||
| Commercial loans | 3,466 | 3,590 | ||||||
| Consumer loans | 31 | 45 | ||||||
| Total loan interest | 20,665 | 20,893 | ||||||
| Securities | 5,387 | 6,074 | ||||||
| Other interest earning assets | 23 | 19 | ||||||
| Total interest income | 26,075 | 26,986 | ||||||
| Interest expense: | ||||||||
| Deposits | 1,575 | 2,473 | ||||||
| Repurchase agreements | 79 | 106 | ||||||
| Borrowed funds | 694 | 652 | ||||||
| Total interest expense | 2,348 | 3,231 | ||||||
| Net interest income | 23,727 | 23,755 | ||||||
| Provision for loan losses | 2,350 | 3,510 | ||||||
| Net interest income after provision for loan losses | 21,377 | 20,245 | ||||||
| Noninterest income: | ||||||||
| Fees and service charges | 2,677 | 2,501 | ||||||
| Wealth management operations | 1,264 | 1,177 | ||||||
| Gain on sale of securities, net | 1,120 | 966 | ||||||
| Gain on sale of loans, net | 987 | 256 | ||||||
| Benefit from bank owned life insurance | 587 | - | ||||||
| Gain on sale of foreclosed real estate | 430 | 887 | ||||||
| Increase in cash value of bank owned life insurance | 381 | 398 | ||||||
| Other-than-temporary credit impairment of debt securities | (6 | ) | (18 | ) | ||||
| Noncredit portion of other-than-temporary impairment of debt securities recognized in other comprehensive income | - | 17 | ||||||
| Other | 96 | 63 | ||||||
| Total noninterest income | 7,536 | 6,247 | ||||||
| Noninterest expense: | ||||||||
| Compensation and benefits | 10,783 | 9,953 | ||||||
| Occupancy and equipment | 3,064 | 3,333 | ||||||
| Data processing | 1,073 | 1,005 | ||||||
| Federal deposit insurance premiums | 571 | 946 | ||||||
| Marketing | 380 | 403 | ||||||
| Statement and check processing | 317 | 329 | ||||||
| Professional services | 279 | 429 | ||||||
| Other | 3,652 | 3,530 | ||||||
| Total noninterest expense | 20,119 | 19,928 | ||||||
| Income before income tax expenses | 8,794 | 6,564 | ||||||
| Income tax expenses | 1,941 | 1,179 | ||||||
| Net income | $ | 6,853 | $ | 5,385 | ||||
| Earnings per common share: | ||||||||
| Basic | $ | 2.41 | $ | 1.90 | ||||
| Diluted | $ | 2.41 | $ | 1.90 | ||||
| Dividends declared per common share | $ | 0.72 | $ | 0.60 | ||||
See accompanying notes to consolidated financial statements.
| 22 |
Consolidated Statements of
Comprehensive Income
| (Dollars in thousands) | Year Ended December 31, | |||||||
| 2012 | 2011 | |||||||
| Net income | $ | 6,853 | $ | 5,385 | ||||
| Net change in net unrealized gains and losses on securities available-for-sale: | ||||||||
| Unrealized gains arising during the period | 813 | 5,607 | ||||||
| Less: reclassification adjustment for gains included in net income | (1,114 | ) | (965 | ) | ||||
| Net securities (loss)/gain during the period | (301 | ) | 4,642 | |||||
| Tax effect | 109 | (1,605 | ) | |||||
| Net of tax amount | (192 | ) | 3,037 | |||||
| Net change in unrecognized gain on postretirement benefit: | ||||||||
| Net gain/(loss) on post retirement benefit | 1 | (2 | ) | |||||
| Amortization of net actuarial gain | (6 | ) | (7 | ) | ||||
| Net loss during the period | (5 | ) | (9 | ) | ||||
| Tax effect | - | - | ||||||
| Net of tax amount | (5 | ) | (9 | ) | ||||
| Other comprehensive (loss) income, net of tax | (197 | ) | 3,028 | |||||
| Comprehensive income, net of tax | $ | 6,656 | $ | 8,413 | ||||
See accompanying notes to consolidated financial statements.
| 23 |
Consolidated Statements of
Changes in Stockholders’ Equity
| (Dollars in thousands, except per share data) | Accumulated | |||||||||||||||||||||||
| Additional | Other | |||||||||||||||||||||||
| Common | Paid-in | Comprehensive | Retained | Treasury | Total | |||||||||||||||||||
| Stock | Capital | Income (loss) | Earnings | Stock | Equity | |||||||||||||||||||
| Balance at January 1, 2011 | $ | 361 | $ | 5,140 | $ | (492 | ) | $ | 52,398 | $ | (1,318 | ) | $ | 56,089 | ||||||||||
| Comprehensive income: | ||||||||||||||||||||||||
| Net income | - | - | - | 5,385 | - | 5,385 | ||||||||||||||||||
| Net unrealized gain/(loss) on securities available-for- sale, net of reclassification and tax effects | - | - | 3,037 | - | - | 3,037 | ||||||||||||||||||
| Change in unrealized gain on post retirement benefit, net of reclassification and tax effects | - | - | (9 | ) | - | - | (9 | ) | ||||||||||||||||
| Comprehensive income | 8,413 | |||||||||||||||||||||||
| Stock-based compensation expense | - | 33 | - | - | - | 33 | ||||||||||||||||||
| Sale of treasury stock | - | - | - | (52 | ) | 176 | 124 | |||||||||||||||||
| Cash dividends, $0.60 per share | - | - | - | (1,699 | ) | - | (1,699 | ) | ||||||||||||||||
| Balance at December 31, 2011 | $ | 361 | $ | 5,173 | $ | 2,536 | $ | 56,032 | $ | (1,142 | ) | $ | 62,960 | |||||||||||
| Comprehensive income: | ||||||||||||||||||||||||
| Net income | - | - | - | 6,853 | - | 6,853 | ||||||||||||||||||
| Net unrealized gain/(loss) on securities available-for- sale, net of reclassification and tax effects | - | - | (192 | ) | - | - | (192 | ) | ||||||||||||||||
| Change in unrealized gain on post retirement benefit, net of reclassification and tax effects | - | - | (5 | ) | - | - | (5 | ) | ||||||||||||||||
| Comprehensive income | 6,656 | |||||||||||||||||||||||
| Stock-based compensation expense | - | 16 | - | - | - | 16 | ||||||||||||||||||
| Purchase of treasury stock | - | - | - | - | (78 | ) | (78 | ) | ||||||||||||||||
| Sale of treasury stock | - | - | - | (24 | ) | 165 | 141 | |||||||||||||||||
| Cash dividends, $0.72 per share | - | - | - | (2,044 | ) | - | (2,044 | ) | ||||||||||||||||
| Balance at December 31, 2012 | $ | 361 | $ | 5,189 | $ | 2,339 | $ | 60,817 | $ | (1,055 | ) | $ | 67,651 | |||||||||||
See accompanying notes to consolidated financial statements.
| 24 |
Consolidated Statements of Cash Flows
NorthWest Indiana Bancorp
Consolidated Statements of Cash Flows
(unaudited)
| (Dollars in thousands) | Year ended December 31, | |||||||
| 2012 | 2011 | |||||||
| CASH FLOWS FROM OPERATING ACTIVITIES: | ||||||||
| Net income | $ | 6,853 | $ | 5,385 | ||||
| Adjustments to reconcile net income to net cash provided by operating activities: | ||||||||
| Origination of loans for sale | (26,049 | ) | (10,043 | ) | ||||
| Sale of loans originated for sale | 26,405 | 10,652 | ||||||
| Depreciation and amortization, net of accretion | 2,293 | 2,198 | ||||||
| Deferred tax expense/(benefit) | 152 | 318 | ||||||
| Amortization of mortgage servicing rights | 117 | 133 | ||||||
| Stock based compensation expense | 16 | 33 | ||||||
| Gain on sale of securities, net | (1,120 | ) | (966 | ) | ||||
| Gain on sale of loans held-for-sale, net | (987 | ) | (256 | ) | ||||
| Net losses due to other-than-temporary impairment of securities | 6 | 1 | ||||||
| Gain on sale of foreclosed real estate | (430 | ) | (887 | ) | ||||
| Benefit from bank owned life insurance | (587 | ) | - | |||||
| Provision for loan losses | 2,350 | 3,510 | ||||||
| Net change in: | ||||||||
| Interest receivable | 71 | 37 | ||||||
| Other assets | 1,559 | 1,274 | ||||||
| Cash value of bank owned life insurance | (381 | ) | (398 | ) | ||||
| Accrued expenses and other liabilities | (1,740 | ) | 3,829 | |||||
| Total adjustments | 1,675 | 9,435 | ||||||
| Net cash - operating activities | 8,528 | 14,820 | ||||||
| CASH FLOWS FROM INVESTING ACTIVITIES: | ||||||||
| Proceeds from maturities and pay downs of securities available-for-sale | 53,862 | 42,536 | ||||||
| Proceeds from sales of securities available-for-sale | 25,900 | 22,713 | ||||||
| Purchase of securities available-for-sale | (80,375 | ) | (88,689 | ) | ||||
| Proceeds from maturities and pay downs of securities held-to-maturity | - | 1,807 | ||||||
| Proceeds from sale of loans transferred to loans held-for-sale | 3,591 | - | ||||||
| Loan participations purchased | (14,475 | ) | (999 | ) | ||||
| Net change in loans receivable | (27,839 | ) | 11,553 | |||||
| Proceeds from sale of Federal Home Loan Bank stock | - | 295 | ||||||
| Purchase of premises and equipment, net | (797 | ) | (417 | ) | ||||
| Proceeds from sale of foreclosed real estate, net | 3,834 | 3,380 | ||||||
| Net cash - investing activities | (36,299 | ) | (7,821 | ) | ||||
| CASH FLOWS FROM FINANCING ACTIVITIES: | ||||||||
| Change in deposits | 39,528 | 6,610 | ||||||
| Proceeds from FHLB advances | 2,000 | 10,000 | ||||||
| Repayment of FHLB advances | (5,000 | ) | (3,000 | ) | ||||
| Change in other borrowed funds | 492 | (3,605 | ) | |||||
| Proceeds from sale of treasury stock | 141 | 124 | ||||||
| Dividends paid | (1,928 | ) | (1,699 | ) | ||||
| Treasury stock purchased | (78 | ) | - | |||||
| Net cash - financing activities | 35,155 | 8,430 | ||||||
| Net change in cash and cash equivalents | 7,384 | 15,429 | ||||||
| Cash and cash equivalents at beginning of period | 26,367 | 10,938 | ||||||
| Cash and cash equivalents at end of period | $ | 33,751 | $ | 26,367 | ||||
| SUPPLEMENTAL CASH FLOW INFORMATION: | ||||||||
| Cash paid during the period for: | ||||||||
| Interest | $ | 2,363 | $ | 3,245 | ||||
| Income taxes | $ | 2,123 | $ | 776 | ||||
| SUPPLEMENTAL NONCASH INFORMATION: | ||||||||
| Transfers from securities held-to-maturity to available-for-sale | $ | - | $ | 16,437 | ||||
| Transfers from loans to loans held-for-sale | $ | 3,428 | $ | - | ||||
| Transfers from loans to foreclosed real estate | $ | 1,626 | $ | 2,371 | ||||
See accompanying notes to consolidated financial statements.
| 25 |
Notes to Consolidated Financial Statements
Years ended December 31, 2012 and 2011
NOTE 1 - Summary of Significant Accounting Policies
Principles of Consolidation - The consolidated financial statements include NorthWest Indiana Bancorp (the “Bancorp”), its wholly owned subsidiary, Peoples Bank SB (the “Bank”), and the Bank’s wholly owned subsidiaries, Peoples Service Corporation, NWIN, LLC, and NWIN Funding, Incorporated, and Columbia Development Company, LLC. The Bancorp has no other business activity other than being a holding company for the Bank. The Bancorp’s earnings are dependent upon the earnings of the Bank. Peoples Service Corporation provides insurance and annuity investments to the Bank’s wealth management customers. NWIN, LLC is located in Las Vegas, Nevada and serves as the Bank’s investment subsidiary and parent of a real estate investment trust, NWIN Funding, Inc. NWIN Funding, Inc. was formed as an Indiana Real Estate Investment Trust. The formation of NWIN Funding, Inc. provides the Bancorp with a vehicle that may be used to raise capital utilizing portfolio mortgages as collateral, without diluting stock ownership. In addition, NWIN Funding, Inc. will receive favorable state tax treatment for income generated by its operations. Columbia Development Company is a limited liability company that serves to hold certain real estate properties that are acquired through foreclosure. All significant inter-company accounts and transactions have been eliminated in consolidation.
Use of Estimates - Preparing financial statements in conformity with accounting principles generally accepted in the United States of America requires management to make estimates and assumptions that affect the reported amounts of assets, liabilities and disclosure of contingent assets and liabilities at the date of the financial statements and the reported amounts of revenue and expenses during the reporting period, as well as the disclosures provided. Actual results could differ from those estimates. Estimates associated with the allowance for loan losses, mortgage servicing rights, fair values of foreclosed real estate, financial instruments and investment securities, and the status of contingencies are particularly susceptible to material change in the near term.
Concentrations of Credit Risk - The Bancorp grants residential, commercial real estate, commercial business and installment loans to customers primarily in Lake County, in northwest Indiana. The Bancorp is also an active lender in Porter County, and to a lesser extent, LaPorte, Newton, and Jasper counties in Indiana, and Lake, Cook and Will counties in Illinois. Substantially all loans are secured by specific items of collateral including residences, commercial real estate, business assets, and consumer assets.
Cash Flow Reporting - For purposes of the statements of cash flows, the Bancorp considers cash on hand, noninterest bearing deposits in other financial institutions, all interest-bearing deposits in other financial institutions with original maturities of ninety days or less, and federal funds sold to be cash and cash equivalents. The Bancorp reports net cash flows for customer loan and deposit transactions and short-term borrowings with maturities of 90 days or less.
Securities - The Bancorp classifies securities into held-to-maturity, available-for-sale, or trading categories. Held-to-maturity securities are those which management has the positive intent and the Bancorp has the ability to hold to maturity, and are reported at amortized cost. Available-for-sale securities are those the Bancorp may decide to sell if needed for liquidity, asset-liability management or other reasons. Available-for-sale securities are reported at fair value, with unrealized gains and losses reported in other comprehensive income, net of tax. During 2011, the Bancorp transferred the balance of its held-to-maturity securities to the available-for-sale classification. The Bancorp does not have a trading portfolio. Realized gains and losses resulting from the sale of securities recorded on the trade date are computed by the specific identification method. Interest and dividend income, adjusted by amortization of premiums or discounts on a level yield method, are included in earnings. Securities are reviewed for other-than-temporary impairment on a quarterly basis.
The Bancorp considers the following factors when determining an other-than-temporary impairment for a security: the length of time and the extent to which the market value has been less than amortized cost; the financial condition and near-term prospects of the issuer; the underlying fundamentals of the relevant market and the outlook for such market for the near future; and an assessment of whether the Bancorp has (1) the intent to sell the debt security or (2) it is more likely than not that the Bancorp will be required to sell the debt security before its anticipated market recovery. If either of these conditions are met, management will recognize other-than-temporary impairment. If, in management’s judgment, an other-than-temporary impairment exists, the cost basis of the security will be written down for the credit loss, and the unrealized credit loss will be transferred from accumulated other comprehensive loss as an immediate reduction of current earnings.
Loans Held-for-Sale - Mortgage loans originated and intended for sale in the secondary market are carried at the lower of aggregate cost or fair market value, as determined by outstanding commitments from investors. Net unrealized losses, if any, are recorded as a valuation allowance and charged to earnings.
Mortgage loans held-for-sale can be sold with servicing rights retained or released. The carrying value of mortgage loans sold is reduced by the amount allocated to the servicing rights. Gains and losses on sales of mortgage loans are based on the difference between the selling price and the carrying value of the related loan sold.
Loans and Loan Income - Loans that management has the intent and ability to hold for the foreseeable future or until maturity or payoff are reported at the principal balance outstanding, net of unearned interest, net deferred loan fees and costs, and an allowance for loan losses. Interest income is accrued on the unpaid principal balance. Loan origination fees, net of certain direct origination costs, are deferred and recognized in interest income using the level-yield method without anticipating prepayments.
The accrual of interest income on mortgage and commercial loans is discontinued at the time the loan is 90 days delinquent unless the loan is well-secured and in process of collection. Consumer loans are typically charged-off no later than when they reach 120 days past due. Past due status is based on the contractual terms of the loan. In all cases, loans are placed on non-accrual or charged-off status at an earlier date if collection of principal or interest is considered doubtful.
| 26 |
Generally, interest accrued but not received for loans placed on non-accrual status is reversed against interest income. Interest received on such loans is accounted for on the cash-basis or cost-recovery method, until qualifying for return to accrual. Loans are returned to accrual status when all the principal and interest amounts contractually due are brought current and future payments are reasonably assured.
Allowance for Loan Losses – The allowance for loan losses (allowance) is a valuation allowance for probable incurred credit losses. Loan losses are charged against the allowance when management believes the uncollectibility of a loan balance is confirmed. Subsequent recoveries, if any, are credited to the allowance. Management estimates the allowance balance required using past loan loss experience, the nature and volume of the portfolio, information about specific borrower situations and estimated collateral values, economic conditions, and other factors. Allocations of the allowance may be made for specific loans, but the entire allowance is available for any loan that, in management’s judgment, should be charged-off.
A loan is considered impaired when, based on current information and events, it is probable that the Bancorp will be unable to collect the scheduled payments of principal or interest when due according to the contractual terms of the loan agreement. Factors considered by management in determining impairment include payment status, collateral value, and the probability of collecting scheduled principal and interest payments when due. Loans that experience insignificant payment delays and payment shortfalls generally are not classified as impaired. Management determines the significance of payment delays and payment shortfalls on a case by case basis, taking into consideration all of the circumstances surrounding the loan and the borrower, including the length of the delay, the reasons for the delay, the borrower’s prior payment record, and the amount of the shortfall in relation to the principal and interest owed. Impairment is measured on a loan by loan basis for commercial and construction loans by either the present value of expected future cash flows discounted at the loan’s effective interest rate, the loan’s obtainable market price, or the fair value of the collateral if the loan is collateral dependent. Large groups of smaller balance homogeneous loans are collectively evaluated for impairment. Accordingly, the Bancorp does not separately identify individual consumer and residential loans for impairment disclosures.
Federal Home Loan Bank Stock – The Bank is a member of the FHLB system. Members are required to own a certain amount of stock based on the level of borrowings and other factors, and may invest in additional amounts. FHLB stock is carried at cost, classified as a restricted security, and periodically evaluated for impairment based on ultimate recovery of par value. Both cash and stock dividends are reported as income.
Transfers of Financial Assets - Transfers of financial assets are accounted for as sales when control over the assets has been surrendered. Control over transferred assets is deemed to be surrendered when (1) the assets have been isolated from the Bancorp, (2) the transferee obtains the right (free of conditions that constrain it from taking advantage of the right) to pledge or exchange the transferred assets, and (3) the Bancorp does not maintain effective control over the transferred assets through an agreement to repurchase them before their maturity.
Premises and Equipment – Land is carried at cost. Premises and equipment are carried at cost less accumulated depreciation. Premises and related components are depreciated using the straight-line method with useful lives ranging from 26 to 39 years. Furniture and equipment are depreciated using the straight-line method with useful lives ranging from 2 to 10 years.
Foreclosed Real Estate – Assets acquired through or instead of loan foreclosure are initially recorded at fair value less estimated costs to sell when acquired, establishing a new cost basis. If fair value declines subsequent to foreclosure, a valuation allowance is recorded through expense. Operating costs after acquisition are expensed.
Long-term Assets – Premises and equipment and other long-term assets are reviewed for impairment when events indicate their carrying amount may not be recoverable from future undiscounted cash flows. If impaired, the assets are recorded at fair value.
Bank Owned Life Insurance - The Bancorp has purchased life insurance policies on certain key executives. In accordance with accounting for split-dollar life insurance, Bank owned life insurance is recorded at the amount that can be realized under the insurance contract at the balance sheet date, which is the cash surrender value adjusted for other charges or other amounts due that are probable at settlement.
Repurchase Agreements – Substantially, all repurchase agreement liabilities represent amounts advanced by various customers that are not covered by federal deposit insurance and are secured by securities owned by the Bancorp.
Postretirement Benefits Other Than Pensions - The Bancorp sponsors a defined benefit postretirement plan that provides comprehensive major medical benefits to all eligible retirees. Postretirement benefits are accrued based on the expected cost of providing postretirement benefits to employees during the years the employees have rendered service to the Bancorp.
Income Taxes - Income tax expense is the total of the current year income tax due or refundable and the change in deferred tax assets and liabilities. Deferred tax assets and liabilities are the expected future tax amounts for the temporary differences between carrying amounts and tax bases of assets and liabilities, computed using enacted tax rates. A valuation allowance, if needed, reduces deferred tax assets to the amount expected to be realized.
Loan Commitments and Related Financial Instruments – Financial instruments include off-balance sheet credit instruments, such as commitments to make loans and standby letters of credit, issued to meet customer financing needs. The face amount for these items represents the exposure to loss, before considering customer collateral or ability to repay. Such financial instruments are recorded when they are funded.
| 27 |
Earnings Per Common Share – Basic earnings per common share is net income divided by the weighted-average number of common shares outstanding during the period. Diluted earnings per common share includes the dilutive effect of additional potential common shares issuable under stock options.
Comprehensive Income – Comprehensive income consists of net income and other comprehensive income. Other comprehensive income includes unrealized gains and losses on securities available-for-sale and the unrecognized gains and losses on postretirement benefits.
Loss Contingencies – Loss contingencies, including claims and legal actions arising in the ordinary course of business, are recorded as liabilities when the likelihood of loss is probable and an amount or range of loss can be reasonably estimated. Management does not believe such matters currently exist that will have a material effect on the financial statements.
Restrictions on Cash - Cash on hand or on deposit with the Federal Reserve Bank of $572,000 and $559,000 was required to meet regulatory reserve and clearing requirements at December 31, 2012 and 2011, respectively. These balances do not earn interest.
Fair Value of Financial Instruments - Fair values of financial instruments are estimated using relevant market information and other assumptions, as more fully disclosed in a separate note. Fair value estimates involve uncertainties and matters of significant judgment regarding interest rates, credit risk, prepayments and other factors, especially in the absence of broad markets for particular instruments. Changes in assumptions or in market conditions could significantly affect the estimates.
Operating Segments – While the Bancorp's executive management monitors the revenue streams of the various products and services, the identifiable segments are not material and operations are managed and financial performance is evaluated on a company-wide basis. Accordingly, all of the Bancorp's financial service operations are considered by management to be aggregated in one reportable operating segment.
Reclassification - Certain amounts appearing in the consolidated financial statements and notes thereto for the year ended December 31, 2011, may have been reclassified to conform to the December 31, 2012 presentation.
Adoption of New Accounting Pronouncements
Update Number 2011-04 – Fair Value Measurement (Topic 820): Amendments to Achieve Common Fair Value Measurement and Disclosure Requirements in U.S. GAAP and IFRS. This update to Fair Value Measurement (Topic 820) results in common fair value measurement and disclosure requirements in U.S. GAAP and IFRS. The amendments in this update explain how to measure fair value. They do not require additional fair value measurements and are not intended to establish valuation standards or affect valuation practices outside of financial reporting. The amendments in this update are to be applied prospectively and are effective during interim and annual periods beginning after December 15, 2011. The Bancorp has adopted this update as of January 1, 2012. Adoption has not resulted in any changes in valuation techniques nor related inputs. Note 15 - Fair Value of Financial Instruments contains expanded disclosure of the level in the fair value hierarchy of inputs that are used in estimating and measuring fair value and information concerning how fair values have been calculated.
Update Number 2011-05 – Comprehensive Income (Topic 220): Presentation of Comprehensive Income. This accounting standard update was issued to increase the prominence of items reported in other comprehensive income and to facilitate the convergence of U.S. GAAP and IFRS. Previous U.S. GAAP allowed the Bancorp to present other comprehensive income as part of the statement of changes in stockholders’ equity. This accounting standard update eliminates that option and requires consecutive presentation of the statement of net income and the statement of comprehensive income. The requirement to report comprehensive income either in a single continuous financial statement or in two separate but consecutive financial statements are effective for public entities for reporting periods beginning after December 15, 2011 and will be applied retrospectively. A Consolidated Statement of Comprehensive Income has been included as part of the Bancorp’s audited financial statements, for the twelve months ended December 31, 2012 and 2011.
Update Number 2011-12 – Comprehensive Income (Topic 220): Deferral of the Effective Date for Amendments to the Presentation of Reclassifications of Items Out of Accumulated Other Comprehensive Income in Accounting Standards update No. 2011-05. This update to Comprehensive Income (Topic 220) defers the requirement to present items that are reclassified from accumulated other comprehensive income to net income separately with their respective components of net income and other comprehensive income. The deferral supersedes only the paragraphs pertaining to how and where reclassification adjustments are presented. The amendments in this update are effective for public entities for reporting periods beginning after December 15, 2011. This update has not had an impact on the Bancorp’s financial statements.
| 28 |
NOTE 2 – Securities
The fair value of available-for-sale securities and the related gross unrealized gains and losses recognized in accumulated other comprehensive income (loss) were as follows:
| (Dollars in thousands) | ||||||||||||||||
| Gross | Gross | Estimated | ||||||||||||||
| Cost | Unrealized | Unrealized | Fair | |||||||||||||
| Basis | Gains | Losses | Value | |||||||||||||
| December 31, 2012 | ||||||||||||||||
| U.S. government sponsored entities | $ | 23,009 | $ | 94 | $ | (7 | ) | $ | 23,096 | |||||||
| Collateralized mortgage obligations and residential mortgage-backed securities | 96,782 | 3,147 | (15 | ) | 99,914 | |||||||||||
| Municipal securities | 58,946 | 4,155 | (28 | ) | 63,073 | |||||||||||
| Collateralized debt obligations | 5,208 | - | (3,816 | ) | 1,392 | |||||||||||
| Total securities available-for-sale | $ | 183,945 | $ | 7,396 | $ | (3,866 | ) | $ | 187,475 | |||||||
| December 31, 2011 | ||||||||||||||||
| U.S. government sponsored entities | $ | 15,610 | $ | 41 | $ | (3 | ) | $ | 15,648 | |||||||
| Collateralized mortgage obligations and residential mortgage-backed securities | 107,569 | 3,630 | (2 | ) | 111,197 | |||||||||||
| Municipal securities | 54,738 | 4,018 | - | 58,756 | ||||||||||||
| Collateralized debt obligations | 5,214 | - | (3,853 | ) | 1,361 | |||||||||||
| Total securities available-for-sale | $ | 183,131 | $ | 7,689 | $ | (3,858 | ) | $ | 186,962 | |||||||
During August 2011, management transferred its entire held-to-maturity securities portfolio to available-for-sale. The book value of the securities transferred totaled approximately $16.4 million, with an unrealized gain of approximately $1.0 million that was recorded as a component of other comprehensive income at the date of transfer. All held-to-maturity securities were transferred to available-for-sale to avoid the potential implication that any remaining held-to-maturity securities would be tainted by a partial transfer. In addition, the transfer provides management the ability to sell lower balance odd lot securities, divest of certain securities to reduce credit or interest rate risk within the portfolio, and be positioned to take advantage of other portfolio restructuring opportunities.
The fair value of available-for-sale debt securities and carrying amount, if different, at year end 2012 by contractual maturity were as follows. Securities not due at a single maturity date, primarily mortgage-backed securities, are shown separately.
| (Dollars in thousands) | ||||||||
| Available-for-sale | ||||||||
| Estimated | Tax- | |||||||
| Fair | Equivalent | |||||||
| December 31, 2012 | Value | Yield (%) | ||||||
| Due in one year or less | $ | 972 | 5.98 | |||||
| Due from one to five years | 14,942 | 3.08 | ||||||
| Due from five to ten years | 38,313 | 4.16 | ||||||
| Due over ten years | 33,334 | 4.81 | ||||||
| Collateralized mortgage obligations and residential mortgage-backed securities | 99,914 | 2.86 | ||||||
| Total | $ | 187,475 | 3.51 | |||||
Sales of available-for-sale securities were as follows:
| (Dollars in thousands) | ||||||||
| December 31, | December 31, | |||||||
| 2012 | 2011 | |||||||
| Proceeds | $ | 25,900 | 22,713 | |||||
| Gross gains | 1,120 | 981 | ||||||
| Gross losses | - | (15 | ) | |||||
The tax provisions related to these net realized gains were approximately $440,000 for 2012 and $380,000 for 2011.
Accumulated other comprehensive income/(loss) balances, net of tax, related to available-for-sale securities, were as follows:
| (Dollars in thousands) | ||||
| Unrealized | ||||
| gain/(loss) | ||||
| Beginning balance, December 31, 2011 | $ | 2,476 | ||
| Current period change | (192 | ) | ||
| Ending balance, December 31, 2012 | $ | 2,284 | ||
Securities with carrying values of approximately $32,935,000 and $70,412,000 were pledged as of December 31, 2012 and 2011, respectively, as collateral for repurchase agreements, public funds, and for other purposes as permitted or required by law. The reduction in pledged securities is a result of the lifting of a state requirement to pledge securities for public funds on deposit.
Securities with unrealized losses at December 31, 2012 and 2011 not recognized in income are as follows:
| (Dollars in thousands) | ||||||||||||||||||||||||
| Less than 12 months | 12 months or longer | Total | ||||||||||||||||||||||
| Estimated | Estimated | Estimated | ||||||||||||||||||||||
| Fair | Unrealized | Fair | Unrealized | Fair | Unrealized | |||||||||||||||||||
| Value | Losses | Value | Losses | Value | Losses | |||||||||||||||||||
| December 31, 2012 | ||||||||||||||||||||||||
| U.S. government sponsored entities | $ | 3,492 | $ | (7 | ) | $ | - | $ | - | $ | 3,492 | $ | (7 | ) | ||||||||||
| Collateralized mortgage obligations and residential mortgage-backed securities | 2,294 | (15 | ) | - | - | 2,294 | (15 | ) | ||||||||||||||||
| Municipal securities | 3,330 | (28 | ) | - | - | 3,330 | (28 | ) | ||||||||||||||||
| Collateralized debt obligations | - | - | 1,392 | (3,816 | ) | 1,392 | (3,816 | ) | ||||||||||||||||
| Total temporarily impaired | $ | 9,116 | $ | (50 | ) | $ | 1,392 | $ | (3,816 | ) | $ | 10,508 | $ | (3,866 | ) | |||||||||
| Number of securities | 14 | 4 | 18 | |||||||||||||||||||||
| (Dollars in thousands) | ||||||||||||||||||||||||
| Less than 12 months | 12 months or longer | Total | ||||||||||||||||||||||
| Estimated | Estimated | Estimated | ||||||||||||||||||||||
| Fair | Unrealized | Fair | Unrealized | Fair | Unrealized | |||||||||||||||||||
| Value | Losses | Value | Losses | Value | Losses | |||||||||||||||||||
| December 31, 2011 | ||||||||||||||||||||||||
| U.S. government sponsored entities | $ | 1,287 | $ | (3 | ) | $ | - | $ | - | $ | 1,287 | $ | (3 | ) | ||||||||||
| Collateralized mortgage obligations and residential mortgage-backed securities | 2,030 | (2 | ) | - | - | 2,030 | (2 | ) | ||||||||||||||||
| Municipal securities | - | - | - | - | - | - | ||||||||||||||||||
| Collateralized debt obligations | - | - | 1,361 | (3,853 | ) | 1,361 | (3,853 | ) | ||||||||||||||||
| Total temporarily impaired | $ | 3,317 | $ | (5 | ) | $ | 1,361 | $ | (3,853 | ) | $ | 4,678 | $ | (3,858 | ) | |||||||||
| Number of securities | 2 | 4 | 6 | |||||||||||||||||||||
Unrealized losses on securities have not been recognized into income because the securities are of high credit quality or have undisrupted cash flows. Management has the intent and ability to hold the securities for the foreseeable future, and the decline in fair value is largely due to changes in interest rates and volatility in the securities markets. The fair values are expected to recover as the securities approach maturity
| 29 |
NOTE 3 – Loans Receivable
Year end loans are summarized below:
| (Dollars in thousands) | ||||||||
| 2012 | 2011 | |||||||
| Loans secured by real estate: | ||||||||
| Construction and land development | $ | 23,984 | $ | 21,143 | ||||
| Residential, including home equity | 154,945 | 154,426 | ||||||
| Commercial real estate and other dwelling | 179,825 | 153,715 | ||||||
| Total loans secured by real estate | 358,754 | 329,284 | ||||||
| Consumer loans | 350 | 472 | ||||||
| Commercial business | 69,310 | 63,384 | ||||||
| Government and other | 8,869 | 8,643 | ||||||
| Subtotal | 437,283 | 401,783 | ||||||
| Less: | ||||||||
| Net deferred loan origination fees | (251 | ) | (264 | ) | ||||
| Undisbursed loan funds | (51 | ) | (118 | ) | ||||
| Loans receivable | $ | 436,981 | $ | 401,401 | ||||
The Bancorp’s activity in the allowance for loan losses, by loan segment, is summarized below for the years indicated.
| Commercial Real | ||||||||||||||||||||||||||||
| Estate, | ||||||||||||||||||||||||||||
| Construction & | ||||||||||||||||||||||||||||
| Residential | Land | |||||||||||||||||||||||||||
| Real Estate, | Development, | Commercial | Commercial | |||||||||||||||||||||||||
| Including | Consumer | and Other | Participations | Business | Government | |||||||||||||||||||||||
| (Dollars in thousands) | Home Equity | Loans | Dwellings | Purchased | Loans | Loans | Total | |||||||||||||||||||||
| The Bancorp's activity in the allowance for loan losses is summarized below for the twelve months ended December 31, 2012: | ||||||||||||||||||||||||||||
| Allowance for loan losses: | ||||||||||||||||||||||||||||
| Beginning Balance | $ | 1,161 | $ | 15 | $ | 3,329 | $ | 2,399 | $ | 1,101 | $ | - | $ | 8,005 | ||||||||||||||
| Charge-offs | (336 | ) | (17 | ) | (256 | ) | (873 | ) | (619 | ) | - | (2,101 | ) | |||||||||||||||
| Recoveries | 4 | 5 | 13 | 108 | 37 | - | 167 | |||||||||||||||||||||
| Provisions | 195 | 16 | 1,464 | (26 | ) | 701 | - | 2,350 | ||||||||||||||||||||
| Ending Balance | $ | 1,024 | $ | 19 | $ | 4,550 | $ | 1,608 | $ | 1,220 | $ | - | $ | 8,421 | ||||||||||||||
The Bancorp's activity in the allowance for loan losses is summarized below for the twelve months ended December 31, 2011:
| Allowance for loan losses: | ||||||||||||||||||||||||||||
| Beginning Balance | $ | 994 | $ | 30 | $ | 2,773 | $ | 4,704 | $ | 620 | $ | - | $ | 9,121 | ||||||||||||||
| Charge-offs | (469 | ) | (57 | ) | (880 | ) | (3,366 | ) | (163 | ) | - | $ | (4,935 | ) | ||||||||||||||
| Recoveries | 112 | 11 | 183 | - | 3 | - | $ | 309 | ||||||||||||||||||||
| Provisions | 524 | 31 | 1,253 | 1,061 | 641 | - | $ | 3,510 | ||||||||||||||||||||
| Ending Balance | $ | 1,161 | $ | 15 | $ | 3,329 | $ | 2,399 | $ | 1,101 | $ | - | $ | 8,005 |
The Bancorp's allowance for loan losses impairment evaluation and financing receivables are summarized below at December 31, 2012:
| Ending balance: individually | ||||||||||||||||||||||||||||
| evaluated for impairment | $ | 9 | $ | - | $ | 1,783 | $ | - | $ | 209 | $ | - | $ | 2,001 | ||||||||||||||
| Ending balance: collectively | ||||||||||||||||||||||||||||
| evaluated for impairment | $ | 1,015 | $ | 19 | $ | 2,767 | $ | 1,608 | $ | 1,011 | $ | - | $ | 6,420 | ||||||||||||||
| FINANCING RECEIVABLES | ||||||||||||||||||||||||||||
| Ending balance | $ | 154,627 | $ | 347 | $ | 175,769 | $ | 28,040 | $ | 69,329 | $ | 8,869 | $ | 436,981 | ||||||||||||||
| Ending balance: individually | ||||||||||||||||||||||||||||
| evaluated for impairment | $ | 692 | $ | - | $ | 10,778 | $ | 6,378 | $ | 2,032 | $ | - | $ | 19,880 | ||||||||||||||
| Ending balance: collectively | ||||||||||||||||||||||||||||
| evaluated for impairment | $ | 153,935 | $ | 347 | $ | 164,991 | $ | 21,662 | $ | 67,297 | $ | 8,869 | $ | 417,101 |
The Bancorp's allowance for loan losses impairment evaluation and financing receivables are summarized below at December 31, 2011:
| Ending balance: individually | ||||||||||||||||||||||||||||
| evaluated for impairment | $ | 10 | $ | - | $ | 1,043 | $ | 252 | $ | 304 | $ | - | $ | 1,609 | ||||||||||||||
| Ending balance: collectively | ||||||||||||||||||||||||||||
| evaluated for impairment | $ | 1,151 | $ | 15 | $ | 2,286 | $ | 2,147 | $ | 797 | $ | - | $ | 6,396 | ||||||||||||||
| FINANCING RECEIVABLES | ||||||||||||||||||||||||||||
| Ending balance | $ | 154,135 | $ | 472 | $ | 154,618 | $ | 20,240 | $ | 63,293 | $ | 8,643 | $ | 401,401 | ||||||||||||||
| Ending balance: individually | ||||||||||||||||||||||||||||
| evaluated for impairment | $ | 1,282 | $ | - | $ | 11,007 | $ | 7,170 | $ | 2,214 | $ | - | $ | 21,673 | ||||||||||||||
| Ending balance: collectively | ||||||||||||||||||||||||||||
| evaluated for impairment | $ | 152,853 | $ | 472 | $ | 143,611 | $ | 13,070 | $ | 61,079 | $ | 8,643 | $ | 379,728 |
| 30 |
The Bancorp has established a standard loan grading system to assist management, lenders and review personnel in their analysis and supervision of the loan portfolio. The use and application of theses grades by the Bancorp is uniform and conforms to regulatory definitions. The loan grading system is as follows:
2 - Moderate risk
Borrower consistently internally generates sufficient cash flow to fund debt service, working assets, and some capital expenditures. Risk of default considered low.
3 – Acceptable risk
Borrower generates sufficient cash flow to fund debt service, but most working asset and all capital expansion needs are provided from external sources. Profitability ratios and key balance sheet ratios are usually close to peers but one or more ratios (e.g. leverage) may be higher than peer. Earnings may be trending down over the last three years. Borrower may be able to obtain similar financing from other banks with comparable or less favorable terms. Risk of default is acceptable but requires collateral protection.
4 – Pass/monitor
The borrower has significant weaknesses resulting from performance trends or management concerns. The financial condition of the company has taken a negative turn and may be temporarily strained. Cash flow may be weak but cash reserves remain adequate to meet debt service. Management weaknesses are evident. Borrowers in this category will warrant more than the normal level of supervision and more frequent reporting.
5 – Special mention (watch)
Special mention credits are considered bankable assets with no apparent loss of principal or interest envisioned but requiring a high level of management attention. Assets in this category are currently protected but are potentially weak. These borrowers are subject to economic, industry, or management factors having an adverse impact upon their prospects for orderly service of debt. The perceived risk in continued lending is considered to have increased beyond the level where such loans would normally be granted. These assets constitute an undue and unwarranted credit risk, but not to the point of justifying a classification of Substandard.
6 – Substandard
This classification consists of loans which are inadequately protected by the current sound worth and paying capacity of the obligor or of the collateral pledged. Financial statements normally reveal some or all of the following: poor trends, lack of earnings and cash flow, excessive debt, lack of liquidity, and the absence of creditor protection. Loans are still considered collectible, but due to increased risks and defined weaknesses of the credit, some loss could be incurred in collection if the deficiencies are not corrected.
7 – Doubtful
This classification consists of loans where the possibility of loss is high after collateral liquidation based upon existing facts, market conditions, and value. Loss is deferred until certain important and reasonably specific pending factors which may strengthen the credit can be exactly determined. These factors may include proposed acquisitions, liquidation procedures, capital injection and receipt of additional collateral, mergers or refinancing plans.
Performing loans are loans that are paying as agreed and are less than ninety days past due on payments of interest and principal.
The Bancorp's credit quality indicators, are summarized below at December 31:
| (Dollars in thousands) | ||||||||||||||||||||||||||||||||
| Corporate Credit Exposure - Credit Risk Portfolio By Creditworthiness Category | ||||||||||||||||||||||||||||||||
| Commercial Real Estate, Construction | Government | |||||||||||||||||||||||||||||||
| & Land Development, and Other Dwellings | Commercial Participations Purchased | Commercial Business Loans | Loans | |||||||||||||||||||||||||||||
| Loan Grades | 2012 | 2011 | 2012 | 2011 | 2012 | 2011 | 2012 | 2011 | ||||||||||||||||||||||||
| 2 Moderate risk | $ | 19 | $ | 25 | $ | - | $ | - | $ | 5,674 | $ | 4,467 | $ | - | $ | - | ||||||||||||||||
| 3 Acceptable risk | 110,416 | 85,703 | 15,585 | 2,387 | 45,202 | 37,713 | 8,869 | 8,643 | ||||||||||||||||||||||||
| 4 Pass/monitor | 51,100 | 51,429 | 1,029 | 5,903 | 13,500 | 17,532 | - | - | ||||||||||||||||||||||||
| 5 Special mention (watch) | 3,630 | 5,509 | 5,984 | 4,780 | 3,300 | 978 | - | - | ||||||||||||||||||||||||
| 6 Substandard | 10,604 | 11,952 | 5,442 | 7,170 | 1,653 | 2,603 | - | - | ||||||||||||||||||||||||
| 7 Doubtful | - | - | - | - | - | - | - | - | ||||||||||||||||||||||||
| Total | $ | 175,769 | $ | 154,618 | $ | 28,040 | $ | 20,240 | $ | 69,329 | $ | 63,293 | $ | 8,869 | $ | 8,643 | ||||||||||||||||
| (Dollars in thousands) | ||||||||||||||||
| Consumer Credit Exposure - Credit Risk Profile Based On Payment Activity | ||||||||||||||||
| Residential Real Estate, | ||||||||||||||||
| Including Home Equity | Consumer Loans | |||||||||||||||
| 2012 | 2011 | 2012 | 2011 | |||||||||||||
| Performing | $ | 152,838 | $ | 151,375 | $ | 337 | $ | 472 | ||||||||
| Non-performing | 1,789 | 2,760 | 10 | - | ||||||||||||
| Total | $ | 154,627 | $ | 154,135 | $ | 347 | $ | 472 | ||||||||
| 31 |
The Bancorp's troubled debt restructurings for the periods presented are summarized below:
| (Dollars in thousands) | ||||||||||||||||||||||||
| Pre- | Post- | Pre- | Post- | |||||||||||||||||||||
| Modification | Modification | Modification | Modification | |||||||||||||||||||||
| Outstanding | Outstanding | Outstanding | Outstanding | |||||||||||||||||||||
| Number of | Recorded | Recorded | Number of | Recorded | Recorded | |||||||||||||||||||
| Contracts | Investment | Investment | Contracts | Investment | Investment | |||||||||||||||||||
| December 31, 2012 | December 31, 2011 | |||||||||||||||||||||||
| Troubled debt restructurings during the period: | ||||||||||||||||||||||||
| Residential real estate, including home equity | 7 | $ | 700 | $ | 692 | 14 | $ | 1,290 | $ | 1,282 | ||||||||||||||
| Consumer loans | - | - | - | - | - | - | ||||||||||||||||||
| Commercial real estate, construction & land development, and other dwellings | 3 | 1,440 | 1,440 | 3 | 8,097 | 7,836 | ||||||||||||||||||
| Commercial participations purchased | 1 | 1,290 | 935 | 2 | 7,975 | 5,635 | ||||||||||||||||||
| Commercial business loans | 1 | 108 | 88 | - | - | - | ||||||||||||||||||
| Government loans | - | - | - | - | - | - | ||||||||||||||||||
| Number of | Recorded | Number of | Recorded | |||||||||||||
| Contracts | Investment | Contracts | Investment | |||||||||||||
| December 31, 2012 | December 31, 2011 | |||||||||||||||
| Troubled debt restructurings that subsequently defaulted during the periods presented: | ||||||||||||||||
| Residential real estate, including home equity | 1 | $ | 39 | 1 | $ | 159 | ||||||||||
| Consumer loans | - | - | - | - | ||||||||||||
| Commercial real estate, construction & land development, and other dwellings | - | - | 3 | 6,009 | ||||||||||||
| Commercial participations purchased | - | - | - | - | ||||||||||||
| Commercial business loans | - | - | - | - | ||||||||||||
| Government loans | - | - | - | - | ||||||||||||
All of the loans classified as troubled debt restructurings are also considered impaired. The valuation basis for the Bancorp’s troubled debt restructurings is based on the present value of cash flows, unless consistent cash flows are not present, then the fair value of the collateral securing the loan is the basis for valuation. Troubled debt restructurings that subsequently defaulted during the period are loans that were restructured and, subsequent to restructuring, were moved to nonaccrual status and failed to comply with the guidelines of the restructured note. Troubled debt restructurings that subsequently defaulted are presented for comparison purposes and are relevant only to the period in which the subsequent default occurred.
| 32 |
The Bancorp's individually evaluated impaired loans are summarized below:
| For the twelve months ended | ||||||||||||||||||||
| As of December 31, 2012 | December 31, 2012 | |||||||||||||||||||
| Unpaid | Average | Interest | ||||||||||||||||||
| (Dollars in thousands) | Recorded | Principal | Related | Recorded | Income | |||||||||||||||
| Investment | Balance | Allowance | Investment | Recognized | ||||||||||||||||
| With no related allowance recorded: | ||||||||||||||||||||
| Residential real estate, including home equity | $ | - | $ | - | $ | - | $ | - | $ | - | ||||||||||
| Commercial real estate, construction & land development, and other dwellings | 591 | 591 | - | 652 | 3 | |||||||||||||||
| Commercial participations purchased | 6,378 | 11,047 | - | 5,080 | - | |||||||||||||||
| Commercial business loans | 727 | 1,000 | - | 992 | 32 | |||||||||||||||
| With an allowance recorded: | ||||||||||||||||||||
| Residential real estate, including home equity | 692 | 692 | 9 | 782 | 20 | |||||||||||||||
| Commercial real estate, construction & land development, and other dwellings | 10,187 | 10,271 | 1,783 | 10,207 | 349 | |||||||||||||||
| Commercial participations purchased | - | - | - | 1,394 | - | |||||||||||||||
| Commercial business loans | 1,305 | 1,305 | 209 | 874 | 51 | |||||||||||||||
| Total: | ||||||||||||||||||||
| Residential real estate, including home equity | $ | 692 | $ | 692 | $ | 9 | $ | 782 | $ | 20 | ||||||||||
| Commercial real estate, construction & land development, and other dwellings | $ | 10,778 | $ | 10,862 | $ | 1,783 | $ | 10,859 | $ | 352 | ||||||||||
| Commercial participations purchased | $ | 6,378 | $ | 11,047 | $ | - | $ | 6,474 | $ | - | ||||||||||
| Commercial business loans | $ | 2,032 | $ | 2,305 | $ | 209 | $ | 1,866 | $ | 83 | ||||||||||
| For the twelve months ended | ||||||||||||||||||||
| As of December 31, 2011 | December 31, 2011 | |||||||||||||||||||
| Unpaid | Average | Interest | ||||||||||||||||||
| (Dollars in thousands) | Recorded | Principal | Related | Recorded | Income | |||||||||||||||
| Investment | Balance | Allowance | Investment | Recognized | ||||||||||||||||
| With no related allowance recorded: | ||||||||||||||||||||
| Residential real estate, including home equity | $ | - | $ | - | $ | - | $ | 26 | $ | - | ||||||||||
| Commercial real estate, construction & land development, and other dwellings | 690 | 880 | - | 1,725 | 16 | |||||||||||||||
| Commercial participations purchased | 2,483 | 8,158 | - | 2,946 | 182 | |||||||||||||||
| Commercial business loans | 793 | 818 | - | 386 | 20 | |||||||||||||||
| With an allowance recorded: | ||||||||||||||||||||
| Residential real estate, including home equity | 1,282 | 1,282 | 10 | 278 | - | |||||||||||||||
| Commercial real estate, construction & land development, and other dwellings | 10,317 | 12,662 | 1,043 | 8,698 | 463 | |||||||||||||||
| Commercial participations purchased | 4,687 | 4,687 | 252 | 8,990 | 186 | |||||||||||||||
| Commercial business loans | 1,421 | 1,421 | 304 | 739 | 15 | |||||||||||||||
| Total: | ||||||||||||||||||||
| Residential real estate, including home equity | $ | 1,282 | $ | 1,282 | $ | 10 | $ | 304 | $ | - | ||||||||||
| Commercial real estate, construction & land development, and other dwellings | $ | 11,007 | $ | 13,542 | $ | 1,043 | $ | 10,423 | $ | 479 | ||||||||||
| Commercial participations purchased | $ | 7,170 | $ | 12,845 | $ | 252 | $ | 11,936 | $ | 368 | ||||||||||
| Commercial business loans | $ | 2,214 | $ | 2,239 | $ | 304 | $ | 1,125 | $ | 35 | ||||||||||
| 33 |
The Bancorp's age analysis of past due loans is summarized below:
| (Dollars in thousands) | ||||||||||||||||||||||||||||
| Recorded | ||||||||||||||||||||||||||||
| Greater | Investments | |||||||||||||||||||||||||||
| Than 90 | Greater than | |||||||||||||||||||||||||||
| 30-59 Days | 60-89 Days | Days Past | Total Past | 90 Days and | ||||||||||||||||||||||||
| Past Due | Past Due | Due | Due | Current | Total Loans | Accruing | ||||||||||||||||||||||
| December 31, 2012 | ||||||||||||||||||||||||||||
| Residential real estate, including home equity | $ | 4,172 | $ | 1,145 | $ | 1,448 | $ | 6,765 | $ | 147,862 | $ | 154,627 | $ | - | ||||||||||||||
| Consumer loans | - | - | - | - | 347 | 347 | - | |||||||||||||||||||||
| Commercial real estate, construction & land development, and other dwellings | 4,044 | 390 | 1,993 | 6,427 | 169,342 | 175,769 | 229 | |||||||||||||||||||||
| Commercial participations purchased | 5 | - | 5,442 | 5,447 | 22,593 | 28,040 | - | |||||||||||||||||||||
| Commercial business loans | 689 | 116 | 1,525 | 2,330 | 66,999 | 69,329 | - | |||||||||||||||||||||
| Government loans | - | - | - | - | 8,869 | 8,869 | - | |||||||||||||||||||||
| Total | $ | 8,910 | $ | 1,651 | $ | 10,408 | $ | 20,969 | $ | 416,012 | $ | 436,981 | $ | 229 | ||||||||||||||
| December 31, 2011 | ||||||||||||||||||||||||||||
| Residential real estate, including home equity | $ | 3,413 | $ | 874 | $ | 2,663 | $ | 6,950 | $ | 147,185 | $ | 154,135 | $ | 279 | ||||||||||||||
| Consumer loans | 7 | - | - | 7 | 465 | 472 | - | |||||||||||||||||||||
| Commercial real estate, construction & land development, and other dwellings | 604 | 238 | 1,616 | 2,458 | 152,160 | 154,618 | - | |||||||||||||||||||||
| Commercial participations purchased | 7 | - | 7,169 | 7,176 | 13,064 | 20,240 | - | |||||||||||||||||||||
| Commercial business loans | 458 | 323 | 717 | 1,498 | 61,795 | 63,293 | - | |||||||||||||||||||||
| Government loans | - | - | - | - | 8,643 | 8,643 | - | |||||||||||||||||||||
| Total | $ | 4,489 | $ | 1,435 | $ | 12,165 | $ | 18,089 | $ | 383,312 | $ | 401,401 | $ | 279 | ||||||||||||||
The Bancorp's loans on nonaccrual status are summarized below:
| (Dollars in thousands) | ||||||||
| December 31, | December 31, | |||||||
| 2012 | 2011 | |||||||
| Residential real estate, including home equity | $ | 1,846 | $ | 2,481 | ||||
| Consumer loans | 10 | - | ||||||
| Commercial real estate, construction & land development, and other dwellings | 2,311 | 3,433 | ||||||
| Commercial participations purchased | 5,442 | 7,170 | ||||||
| Commercial business loans | 1,644 | 926 | ||||||
| Government loans | - | - | ||||||
| Total | $ | 11,253 | $ | 14,010 | ||||
During the second quarter of 2012, the Bancorp conducted a $3.4 million sale of portfolio fixed rate mortgage loans, which the Bancorp’s management considers an interest rate risk mitigation to reduce loan prepayment risk. The segment of loans that were sold had a higher premium value and were projected to prepay significantly faster than the mortgage portfolio's average repayment speed. The gain realized from the prepayment risk reduction strategy totaled $183 thousand and was recorded during the second quarter of 2012. The proceeds from the loan sale were used to fund loans with longer durations and similar yields to the loans that were included in the sales strategy.
Note 4 – Premises and Equipment, Net
At year end, premises and equipment are summarized as follows:
| (Dollars in thousands) | ||||||||
| 2012 | 2011 | |||||||
| Cost: | ||||||||
| Land | $ | 4,540 | $ | 4,540 | ||||
| Buildings and improvements | 19,277 | 19,171 | ||||||
| Furniture and equipment | 11,244 | 11,051 | ||||||
| Total cost | 35,061 | 34,762 | ||||||
| Less accumulated depreciation | (17,383 | ) | (16,520 | ) | ||||
| Premises and equipment, net | $ | 17,678 | $ | 18,242 | ||||
Depreciation expense was approximately $1,361,000 and $1,468,000 for 2012 and 2011, respectively.
Note 5 – Foreclosed Real Estate
At year end, foreclosed real estate is summarized below:
| (Dollars in thousands) | ||||||||
| 2012 | 2011 | |||||||
| Residential real estate | $ | 243 | $ | 554 | ||||
| Commercial real estate and other dwellings | 151 | 569 | ||||||
| Construction and land development | 31 | 1,334 | ||||||
| Total | $ | 425 | $ | 2,457 | ||||
| 34 |
Note 6 – Income Taxes
At year-end, components of the income tax expense (benefit) consist of the following:
| (Dollars in thousands) | ||||||||
| 2012 | 2011 | |||||||
| Federal: | ||||||||
| Current | $ | 1,754 | $ | 735 | ||||
| Deferred | 146 | 434 | ||||||
| State: | ||||||||
| Current | 35 | 126 | ||||||
| Deferred, net of valuation allowance | 6 | (116 | ) | |||||
| Income tax expense | $ | 1,941 | $ | 1,179 | ||||
Effective tax rates differ from the federal statutory rate of 34% applied to income before income taxes due to the following:
| (Dollars in thousands) | ||||||||
| 2012 | 2011 | |||||||
| Federal statutory rate | 34 | % | 34 | % | ||||
| Tax expense at statutory rate | $ | 2,990 | $ | 2,232 | ||||
| State tax, net of federal effect | 27 | 7 | ||||||
| Tax exempt income | (806 | ) | (874 | ) | ||||
| Bank owned life insurance | (329 | ) | (135 | ) | ||||
| Tax credits | - | (67 | ) | |||||
| Other | 59 | 16 | ||||||
| Total income tax expense | $ | 1,941 | $ | 1,179 | ||||
At year-end, the components of the net deferred tax asset recorded in the consolidated balance sheets are as follows:
| (Dollars in thousands) | ||||||||
| 2012 | 2011 | |||||||
| Deferred tax assets: | ||||||||
| Bad debts | $ | 3,318 | $ | 3,149 | ||||
| Deferred loan fees | 99 | 104 | ||||||
| Deferred compensation | 486 | 660 | ||||||
| Net operating loss | 875 | 855 | ||||||
| Tax credits | 73 | 62 | ||||||
| Nonaccrual loan interest income | 12 | 22 | ||||||
| Restricted stock awards | 26 | 32 | ||||||
| REO writedowns | 11 | 16 | ||||||
| Unqualified DCP | 55 | 50 | ||||||
| Post retirement benefit | 55 | 58 | ||||||
| Other-than-temporary impairment | 92 | 90 | ||||||
| Accrued vacation | 125 | 63 | ||||||
| Legal reserve | - | 148 | ||||||
| Impairment on land | 75 | 75 | ||||||
| Other | 20 | 42 | ||||||
| Total deferred tax assets | 5,322 | 5,426 | ||||||
| Deferred tax liabilities: | ||||||||
| Depreciation | (1,284 | ) | (1,214 | ) | ||||
| Prepaids | (272 | ) | (246 | ) | ||||
| Mortgage servicing rights | (133 | ) | (122 | ) | ||||
| Deferred stock dividends | (115 | ) | (115 | ) | ||||
| Unrealized appreciation on securities available-for-sale, net | (1,246 | ) | (1,355 | ) | ||||
| Post retirement unrealized gain | (40 | ) | (43 | ) | ||||
| Other | (16 | ) | (91 | ) | ||||
| Total deferred tax liabilities | (3,106 | ) | (3,186 | ) | ||||
| Valuation allowance | (474 | ) | (458 | ) | ||||
| Net deferred tax assets | $ | 1,742 | $ | 1,782 | ||||
At December 31, 2012, the Bancorp has a state net operating loss carry forward of approximately $15.6 million which will begin to expire in 2022 if not used. The Bancorp also has a state tax credit carry forward of approximately $111,000 which will begin to expire in 2017 if not used. A valuation allowance of $474,000 and $458,000 was provided at December 31, 2012 and 2011 for the state net operating loss and state tax credit, which management does not believe will be fully utilized before statutory expiration.
The Bancorp qualified under provisions of the Internal Revenue Code, to deduct from taxable income a provision for bad debts in excess of the provision for such losses charged to income in the financial statements, if any. Accordingly, retained earnings at December 31, 2012 and 2011 includes, approximately $5,982,000 for which no provision for federal income taxes has been made. If, in the future this portion of retained earnings is used for any purpose other than to absorb bad debt losses, federal income taxes would be imposed at the then applicable rate. The unrecorded deferred income tax liability on the above amounts was approximately $2,034,000 at December 31, 2012 and 2011.
The Bancorp had no unrecognized tax benefits at any time during 2012 or 2011 and does not anticipate any significant increase or decrease in unrecognized tax benefits during 2013. Should the accrual of any interest or penalties relative to unrecognized tax benefits be necessary, it is the Bancorp's policy to record such accruals through income tax accounts. No such accruals existed at any time during 2012 or 2011.
The Bancorp and its subsidiaries are subject to United States Federal income tax as well as income tax of the states of Indiana and Illinois. The Bancorp is no longer subject to examination by taxing authorities for the years before 2009 for federal and 2008 for state.
Note 7 – Deposits
The aggregate amount of certificates of deposit with a balance of $250,000 or more was approximately $20,919,000 at December 31, 2012 and $21,108,000 at December 31, 2011.
At December 31, 2012, scheduled maturities of certificates of deposit were as follows:
| (Dollars in thousands) | ||||
| 2013 | $ | 132,028 | ||
| 2014 | 35,340 | |||
| 2015 | 4,216 | |||
| 2016 | 77 | |||
| Thereafter | - | |||
| Total | $ | 171,661 | ||
| 35 |
Note 8 – Borrowed Funds
At year end, borrowed funds are summarized below:
| (Dollars in thousands) | ||||||||
| 2012 | 2011 | |||||||
| Fixed rate advances from the FHLB | 28,000 | 31,000 | ||||||
| Putable advances from the FHLB | 5,000 | 5,000 | ||||||
| Other | 207 | 618 | ||||||
| Total | $ | 33,207 | $ | 36,618 | ||||
At December 31, 2012, scheduled maturities of borrowed funds were as follows:
| (Dollars in thousands) | ||||
| 2013 | $ | 14,207 | ||
| 2014 | 8,000 | |||
| 2015 | 11,000 | |||
| Total | $ | 33,207 | ||
Repurchase agreements generally mature within one year and are secured by U.S. government and U.S. agency securities, under the Bancorp’s control. At year end, information concerning these retail repurchase agreements is summarized below:
| (Dollars in thousands) | ||||||||
| 2012 | 2011 | |||||||
| Ending balance | $ | 16,298 | $ | 15,395 | ||||
| Average balance during the year | 20,561 | 20,767 | ||||||
| Maximum month-end balance during the year | 25,278 | 24,258 | ||||||
| Securities underlying the agreements at year end: | ||||||||
| Carrying value | 28,002 | 26,622 | ||||||
| Fair value | 28,002 | 26,622 | ||||||
| Average interest rate during the year | 0.38 | % | 0.51 | % | ||||
| Average interest rate at year end | 0.31 | % | 0.43 | % | ||||
At year-end, advances from the Federal Home Loan Bank were as follows:
| (Dollars in thousands) | ||||||||
| 2012 | 2011 | |||||||
| Fixed rate advances, maturing January 2013 through | ||||||||
| December 2016 at rates from 0.49% to 2.65%; average rate: 2012 – 1.84%; 2011 – 1.95% | $ | 28,000 | $ | 31,000 | ||||
| Putable advance, maturing February 2013 at a fixed rate of 2.62% | 5,000 | 5,000 | ||||||
Fixed rate advances are payable at maturity, with a prepayment penalty. Putable advances are fixed for a period of one to three years and then may adjust quarterly to the three-month London Interbank Offered Rate until maturity. Once the putable advance interest rate adjusts, the Bancorp has the option to prepay the advance on specified quarterly interest rate reset dates. The advances were collateralized by mortgage loans totaling approximately $164,463,000 and $163,534,000 at December 31, 2012 and 2011, respectively. In addition to the fixed rate and putable advances, the Bancorp maintains a $10,000,000 line of credit with the Federal Home Loan Bank of Indianapolis. There was no outstanding balance on the line of credit at December 31, 2012 or 2011. Other borrowings at December 31, 2012 and 2011 are comprised of reclassified bank balances.
Note 9 – Employees’ Benefit Plans
The Bancorp maintains an Employees’ Savings and Profit Sharing Plan and Trust for all employees who meet the plan qualifications. Employees are eligible to participate in the Employees’ Savings and Profit Sharing Plan and Trust on the next January 1 or July 1 following the completion of one year of employment, age 18, and completion of 1,000 hours of service. The Employees’ Savings Plan feature allows employees to make pre-tax contributions to the Employees’ Savings Plan of 1% to 50% of Plan Salary, subject to limitations imposed by Internal Revenue Code section 401(k). The Profit Sharing Plan and Trust feature is non-contributory on the part of the employee. Contributions to the Employees’ Profit Sharing Plan and Trust are made at the discretion of the Bancorp’s Board of Directors. Contributions for the year ended December 31, 2012 and 2011 were based on 9% and 4%, respectively, of the participants’ total compensation, excluding incentives. Participants in the plan become 100% vested upon completion of five years of service. The benefit plan expense amounted to approximately $677,000 for 2012 and $283,000 for 2011.
The Bancorp maintains an Unqualified Deferred Compensation Plan (the Plan). The purpose of the Plan is to provide deferred compensation to key senior management employees of the Bancorp in order to recognize their substantial contributions to the Bank and provide them with additional financial security as inducement to remain with the Bank. The Compensation Committee selects which persons shall be participants in the Plan. Participants’ accounts are credited each year with an amount based on a formula involving the participant’s employer funded contributions under all qualified plans and the limitations imposed by Internal Revenue Code subsection 401(a)(17) and Code section 415. The unqualified deferred compensation plan liability at December 31, 2012 and 2011 was approximately $141,000 and $127,000, respectively. The Plan expense amounted to $14,000 for 2012 and $8,000 for 2011.
Directors have deferred some of their fees in consideration of future payments. Fee deferrals, including interest, totaled approximately $91,000 and $108,000 for 2012 and 2011, respectively. The deferred fee liability at December 31, 2012 and 2011 was approximately $1,234,000 and $1,678,000, respectively.
| 36 |
Note 10 – Regulatory Capital
The Bancorp and Bank are subject to regulatory capital requirements administered by federal banking agencies. Capital adequacy guidelines and prompt corrective action regulations involve quantitative measures of assets, liabilities, and certain off-balance-sheet items calculated under regulatory accounting practices. Capital amounts and classifications are also subject to qualitative judgments by regulators. Failure to meet various capital requirements can initiate regulatory action. Prompt corrective action regulations provide five classifications, including well capitalized, adequately capitalized, undercapitalized, significantly undercapitalized, and critically undercapitalized, although these terms are not used to represent overall financial condition. If adequately capitalized, regulatory approval is required to accept brokered deposits. If undercapitalized, capital distributions are limited, as is asset growth and expansion, and capital restoration plans are required. At December 31, 2012 and 2011, the most recent regulatory notifications categorized the Bancorp and Bank as well capitalized under the regulatory framework for prompt corrective action. There are no conditions or events since that notification that management believes have changed the Bancorp’s or the Bank’s category.
At year-end, capital levels for the Bancorp and the Bank were essentially the same. Actual capital levels (in millions), minimum required levels and levels needed to be classified as well capitalized for the Bancorp are summarized below:
| Minimum | ||||||||||||||||||||||||
| Required To Be | ||||||||||||||||||||||||
| Well Capitalized | ||||||||||||||||||||||||
| Minimum Required | Under Prompt | |||||||||||||||||||||||
| For Capital | Corrective | |||||||||||||||||||||||
| Actual | Adequacy Purposes | Action Regulations | ||||||||||||||||||||||
| (Dollars in millions) | Amount | Ratio | Amount | Ratio | Amount | Ratio | ||||||||||||||||||
| 2012 | ||||||||||||||||||||||||
| Total capital to risk-weighted assets | $ | 70.1 | 14.6 | % | $ | 38.3 | 8.0 | % | $ | 47.9 | 10.0 | % | ||||||||||||
| Tier 1 capital to risk-weighted assets | $ | 64.1 | 13.4 | % | $ | 19.1 | 4.0 | % | $ | 28.7 | 6.0 | % | ||||||||||||
| Tier 1 capital to adjusted average assets | $ | 64.1 | 9.4 | % | $ | 20.5 | 3.0 | % | $ | 34.2 | 5.0 | % | ||||||||||||
| 2011 | ||||||||||||||||||||||||
| Total capital to risk-weighted assets | $ | 64.9 | 14.3 | % | $ | 36.2 | 8.0 | % | $ | 45.2 | 10.0 | % | ||||||||||||
| Tier 1 capital to risk-weighted assets | $ | 59.2 | 13.1 | % | $ | 18.1 | 4.0 | % | $ | 27.1 | 6.0 | % | ||||||||||||
| Tier 1 capital to adjusted average assets | $ | 59.2 | 9.2 | % | $ | 19.4 | 3.0 | % | $ | 32.3 | 5.0 | % | ||||||||||||
The Bancorp’s ability to pay dividends to its shareholders is entirely dependent upon the Bank’s ability to pay dividends to the Bancorp. Under Indiana law, the Bank may pay dividends from its undivided profits (generally, earnings less losses, bad debts, taxes and other operating expenses) as is considered expedient by the Bank’s Board of Directors. However, the Bank must obtain the approval of the Indiana Department of Financial Institutions (DFI) for the payment of a dividend if the total of all dividends declared by the Bank during the current year, including the proposed dividend, would exceed the sum of retained net income for the year to date plus its retained net income for the previous two years. For this purpose, “retained net income,” means net income as calculated for call report purposes, less all dividends declared for the applicable period. The aggregate amount of dividends that may be declared by the Bank in 2013, without prior DFI approval is $8.7 million plus 2013 net profits. Moreover, the FDIC and the Federal Reserve Board may prohibit the payment of dividends if it determines that the payment of dividends would constitute an unsafe or unsound practice in light of the financial condition of the Bank. On November 30, 2012, the Board of Directors of the Bancorp declared a fourth quarter dividend of $0.19 per share. The Bancorp’s fourth quarter dividend was paid to shareholders on January 4, 2013.
Note 11 – Stock Based Compensation
The Bancorp’s 2004 Stock Option Plan (the Plan), which is stockholder-approved, permits the grant of share options to its employees for up to 250,000 shares of common stock. Awards granted under the Plan may be in the form of incentive stock options, non-incentive stock options, or restricted stock. The purposes of the Plan are to attract and retain the best available personnel, to provide additional incentives for all employees and to encourage their continued employment by facilitating employees’ purchases of an equity interest in the Bancorp. Option awards are generally granted with an exercise price equal to the market price of the Bancorp’s common stock at the date of grant; those option awards have five year vesting periods and have ten year contractual terms. Total compensation cost that has been charged against income for incentive stock options was approximately $1,000 for 2012 and 2011.
The fair value of each incentive stock option award is estimated on the date of grant using a closed form option valuation (Black-Scholes) model. Expected volatilities are based on historical volatilities of the Company’s common stock. No incentive stock options were granted during 2012 or 2011. The Company uses historical data to estimate option exercise and post-vesting termination behavior. The expected term of options granted is based on historical data and represents the period of time that options granted are expected to be outstanding, which takes into account that the options are not transferable. The risk-free interest rate for the expected term of the option is based on the U.S. Treasury yield curve in effect at the time of the grant.
| 37 |
A summary of the Bancorp’s stock option activity for 2012 and 2011 follows:
| Weighted | ||||||||||||||||
| Weighted | Average | |||||||||||||||
| Average | Remaining | Aggregate | ||||||||||||||
| Exercise | Contractual | Intrinsic | ||||||||||||||
| Shares | Price | Term (Years) | Value | |||||||||||||
| Outstanding at January 1, 2011 | 49,247 | $ | 24.27 | |||||||||||||
| Granted | - | - | ||||||||||||||
| Exercised | - | - | ||||||||||||||
| Forfeited or expired | (8,747 | ) | 19.50 | |||||||||||||
| Outstanding at end of year | 40,500 | $ | 25.30 | 1.1 | $ | - | ||||||||||
| Vested or expected to vest | 40,500 | $ | 25.30 | 1.1 | $ | - | ||||||||||
| Exercisable at December 31, 2011 | 39,500 | $ | 25.22 | 1.0 | $ | - | ||||||||||
| Granted | - | - | ||||||||||||||
| Exercised | - | - | ||||||||||||||
| Forfeited or expired | (14,550 | ) | 22.15 | |||||||||||||
| Outstanding at end of year | 25,950 | $ | 27.06 | 0.7 | $ | - | ||||||||||
| Vested or expected to vest | 25,950 | $ | 27.06 | 0.7 | $ | - | ||||||||||
| Exercisable at December 31, 2012 | 24,950 | $ | 27.01 | 0.5 | $ | - | ||||||||||
As of December 31, 2012, there were no unrecognized compensation costs related to non-vested incentive stock options granted under the Plan.
Restricted stock awards are generally granted with an award price equal to the market price of the Bancorp’s common stock on the award date. Restricted stock awards have been issued with a five year vesting period. Forfeiture provisions exist for personnel that separate employment before the vesting period expires. Compensation expense related to restricted stock awards are recognized over the vesting period. Total compensation cost that has been charged against income for those plans was approximately $15,000 and $32,000 for 2012 and 2011, respectively.
A summary of changes in the Bancorp’s non-vested restricted stock for 2012 and 2011 follows:
| Weighted | ||||||||
| Average | ||||||||
| Grant Date | ||||||||
| Non-vested Shares | Shares | Fair Value | ||||||
| Non-vested at January 1, 2011 | 6,750 | $ | 25.72 | |||||
| Granted | - | - | ||||||
| Vested | (3,000 | ) | 31.57 | |||||
| Forefited | - | - | ||||||
| Non-vested at December 31, 2011 | 3,750 | 25.72 | ||||||
| Granted | - | - | ||||||
| Vested | (350 | ) | 29.75 | |||||
| Forefited | - | - | ||||||
| Non-vested at December 31, 2012 | 3,400 | $ | 20.15 | |||||
As of December 31, 2012, there was approximately $17,000 of total unrecognized compensation cost related to non-vested restricted shares granted under the Plan. The cost is expected to be recognized over a weighted-average period of 1.4 years.
Note 12 – Earnings per Common Share
A reconciliation of the numerators and denominators of the basic earnings per common share and diluted earnings per common share computations for 2012 and 2011 is presented below.
| 2012 | 2011 | |||||||
| Basic earnings per common share: | ||||||||
| Net income available to common stockholders | $ | 6,852,915 | $ | 5,384,982 | ||||
| Weighted-average common shares outstanding | 2,839,719 | 2,832,161 | ||||||
| Basic earnings per common share | $ | 2.41 | $ | 1.90 | ||||
| Diluted earnings per common share: | ||||||||
| Net income available to common stockholders | $ | 6,852,915 | $ | 5,384,982 | ||||
| Weighted-average common shares outstanding | 2,839,719 | 2,832,161 | ||||||
| Weighted-average common and dilutive potential common shares outstanding | 2,839,719 | 2,832,161 | ||||||
| Diluted earnings per common share | $ | 2.41 | $ | 1.90 | ||||
There were 25,950 and 40,500 anti-dilutive shares outstanding at December 31, 2012 and 2011, respectively.
Note 13 – Related Party Transactions
The Bancorp had aggregate loans outstanding to directors and executive officers (with individual balances exceeding $120,000) of approximately $4,036,000 at December 31, 2012 and approximately $6,907,000 at December 31, 2011. For the year ended December 31, 2012, the following activity occurred on these loans:
| 38 |
| (Dollars in thousands) | ||||
| Aggregate balance at the beginning of the year | $ | 6,907 | ||
| New loans | 1,174 | |||
| Repayments | (4,045 | ) | ||
| Aggregate balance at the end of the year | $ | 4,036 | ||
Deposits from directors and executive officers totaled approximately $2,774,000 and $2,094,000 at December 31, 2012 and 2011, respectively.
Note 14 – Commitments and Contingencies
The Bancorp is a party to financial instruments in the normal course of business to meet the financing needs of its customers. These financial instruments, which include commitments to make loans and standby letters of credit, are not reflected in the accompanying consolidated financial statements. Such financial instruments are recorded when they are funded.
The Bancorp’s exposure to credit loss in the event of non-performance by the other party to the financial instrument for commitments to originate loans and standby letters of credit is represented by the contractual amount of those instruments. Commitments generally have fixed expiration dates or other termination clauses and may require the payment of a fee. The Bancorp uses the same credit policy to make such commitments as it uses for on-balance sheet items. Since commitments to make loans may expire without being used, the amount does not necessarily represent future cash commitments.
The Bancorp had outstanding commitments to originate loans as follows:
| (Dollars in thousands) | ||||||||||||
| Fixed | Variable | |||||||||||
| Rate | Rate | Total | ||||||||||
| December 31, 2012: | ||||||||||||
| Commercial business | $ | 2,334 | $ | 26,673 | $ | 29,007 | ||||||
| Real estate | 15,979 | 8,581 | 24,560 | |||||||||
| Consumer loans | - | - | - | |||||||||
| Government loans | 4,941 | - | 4,941 | |||||||||
| Unsecured consumer overdrafts | 10,812 | - | 10,812 | |||||||||
| Total | $ | 34,066 | $ | 35,254 | $ | 69,320 | ||||||
| December 31, 2011: | ||||||||||||
| Commercial business | $ | 2,524 | $ | 24,319 | $ | 26,843 | ||||||
| Real estate | 16,510 | 18,730 | 35,240 | |||||||||
| Consumer loans | - | 4 | 4 | |||||||||
| Government loans | 4,941 | - | 4,941 | |||||||||
| Unsecured consumer overdrafts | 10,828 | - | 10,828 | |||||||||
| Total | $ | 34,803 | $ | 43,053 | $ | 77,856 | ||||||
The approximately $34,066,000 in fixed rate commitments outstanding at December 31, 2012 and the approximately $34,803,000 in fixed rate commitments outstanding at December 31, 2011 had interest rates ranging from 2.30% to 10.00%, for a period not to exceed forty-five days. Mortgage interest rate locks with borrowers are a component of real estate commitments, were treated as derivative transactions, and valued accordingly at year-end.
Standby letters of credit are conditional commitments issued by the Bancorp to guarantee the performance of a customer to a third party. At December 31, 2012 and 2011, the Bancorp had standby letters of credit totaling approximately $9,251,000 and $8,696,000, respectively which are not included in the tables above. The Bancorp evaluates each customer’s creditworthiness on a case-by-case basis. The amount of collateral obtained, if deemed necessary by the Bancorp upon extension of credit, is based on management’s credit evaluation of the borrower. Collateral obtained may include accounts receivable, inventory, property, land or other assets.
Note 15 – Fair Values of Financial Instruments
The Fair Value Measurements Topic (the Topic) establishes a hierarchy that requires an entity to maximize the use of observable inputs and minimize the use of unobservable inputs when measuring fair value. The Topic describes three levels of inputs that may be used to measure fair value:
Level 1: Quoted prices (unadjusted) for identical assets or liabilities in active markets that the entity has the ability to access as of the measurement date.
Level 2: Significant other observable inputs other than Level 1 prices such as quoted prices for similar assets or liabilities; quoted prices in markets that are not active; or other inputs that are observable or can be corroborated by observable market data.
Level 3: Significant unobservable inputs that reflect a reporting entity’s own assumptions about the assumptions that market participants would use in pricing an asset or liability.
The fair values of securities available for sale are determined on a recurring basis by obtaining quoted prices on nationally recognized securities exchanges or pricing models utilizing significant observable inputs such as matrix pricing, which is a mathematical technique widely used in the industry to value debt securities without relying exclusively on quoted prices for the specific securities, but rather by relying on the securities’ relationship to other benchmark quoted securities. Different judgment and assumptions used in pricing could result in different estimates of value. In certain cases where market data is not readily available because of lack of market activity or little public disclosure, values may be based on unobservable inputs and classified in Level 3 of the fair value hierarchy.
| 39 |
At the end of each reporting period, securities held in the investment portfolio are evaluated on an individual security level for other-than-temporary impairment in accordance with the Investments – Debt and Equity Securities Topic. Impairment is other-than-temporary if the decline in the fair value of the security is below its amortized cost and it is probable that all amounts due according to the contractual terms of a debt security will not be received. Significant judgments are required in determining impairment, which include making assumptions regarding the estimated prepayments, loss assumptions and the change in interest rates. The Bancorp considers the following factors when determining other-than-temporary impairment for a security: the length of time and the extent to which the market value has been less than amortized cost; the financial condition and near-term prospects of the issuer; the underlying fundamentals of the relevant market and the outlook for such market for the near future; an assessment of whether the Bancorp (1) has the intent to sell the debt securities or (2) more likely than not will be required to sell the debt securities before their anticipated market recovery. If either of these conditions are met, management will recognize other-than-temporary impairment. If, in management’s judgment, an other-than-temporary impairment exists, the cost basis of the security will be written down for the credit loss, and the unrealized loss will be transferred from accumulated other comprehensive loss as an immediate reduction of current earnings.
For the year ended December 31, 2012, the Bancorp’s management utilized a specialist to perform an other-than-temporary impairment analysis for each of its four pooled trust preferred securities. The analysis utilizes analytical models used to project future cash flows for the pooled trust preferred securities based on current assumptions for prepayments, default and deferral rates, and recoveries. The projected cash flows are than tested for impairment consistent with the Investments – Other Topic and the Investments – Debt and Equity Securities Topic. The other-than-temporary impairment testing compares the present value of the cash flows from quarter to quarter to determine if there is a “favorable” or “adverse” change. Other-than-temporary impairment is recorded if the projected present value of cash flows is lower than the book value of the security. To perform the quarterly other-than-temporary impairment analysis, management utilizes current reports issued by the trustee, which contain principal and interest tests, waterfall distributions, note valuations, collection detail and credit ratings for each pooled trust preferred security. In addition, a detailed review of the performing collateral was performed. The review of the collateral began with a review of financial information provided by SNL Financial, a comprehensive database, widely used in the industry, which gathers financial data on banks and thrifts from U.S. GAAP financial statements for public companies (annual and quarterly reports on Forms 10-K and 10-Q), as well as regulatory reports for private companies, including consolidated financial statements for bank holding companies (FR Y-9C reports) and parent company-only financial statements for bank holding companies (FR Y-9LP reports) filed with the Federal Reserve and bank call reports filed with the FDIC and OCC. Using the information sources described above, for each bank and thrift examined, the following items were examined: nature of the issuer’s business, years of operating history, corporate structure, loan composition and loan concentrations, deposit mix, asset growth rates, geographic footprint and local economic environment. The issuers’ historical financial performance was reviewed and their financial ratios were compared to appropriate peer groups of regional banks or thrifts with similar asset sizes. The analysis focused on six broad categories: profitability (revenue streams and earnings quality, return on assets and shareholder’s equity, net interest margin and interest rate sensitivity), credit quality (charge-offs and recoveries, non-current loans and total non-performing assets as a percentage of total loans, loan loss reserve coverage and the adequacy of the loan loss provision), operating efficiency (noninterest expense compared to total revenue), capital adequacy (Tier-1, total capital and leverage ratios and equity capital growth), leverage (tangible equity as a percentage of tangible assets, short-term and long-term borrowings and double leverage at the holding company) and liquidity (the nature and availability of funding sources, net non-core funding dependence and quality of deposits). In addition, for publicly traded companies, stock price movements were reviewed and the market price of publicly traded debt instruments was examined. The other-than-temporary impairment analysis indicated that the Bancorp’s four pooled trust preferred securities had aggregate additional other-than-temporary impairment in the amount of $6,200, for the year ending December 31, 2012.
| 40 |
The table below shows the credit loss roll forward for the Bancorp’s pooled trust preferred securities that have been classified with other-than-temporary impairment:
| (Dollars in thousands) | ||||
| Collateralized debt | ||||
| obligations other-than- | ||||
| temporarily impaired | ||||
| Ending balance - December 31, 2011 | $ | 265 | ||
| Additions not previously recognized | 6 | |||
| Ending balance - December 31, 2012 | $ | 271 | ||
| Cusip | 74043CAC1 | 74042TAJ0 | 01449TAB9 | 01450NAC6 | ||||||||||||
| Deal name | PreTSL XXIV | PreTSL XXVII | Alesco IX | Alesco XVII | ||||||||||||
| Class | B-1 | C-1 | A-2A | B | ||||||||||||
| Book value | $ | 1,256,972 | $ | 1,296,077 | $ | 1,302,536 | $ | 1,351,903 | ||||||||
| Fair value | 249,184 | 246,509 | 568,650 | 327,289 | ||||||||||||
| Unrealized gains/(losses) | (1,007,788 | ) | (1,049,569 | ) | (733,886 | ) | (1,024,614 | ) | ||||||||
| Lowest credit rating assigned | Ca | C | Ba2 | C | ||||||||||||
| Number of performing banks | 48 | 27 | 53 | 44 | ||||||||||||
| Number of performing insurance companies | 13 | 7 | 10 | n/a | ||||||||||||
| Number of issuers in default | 17 | 9 | 2 | 2 | ||||||||||||
| Number of issuers in deferral | 15 | 6 | 11 | 10 | ||||||||||||
| Defaults & deferrals as a % of performing collateral | 51.28 | % | 36.26 | % | 21.05 | % | 39.86 | % | ||||||||
| Subordination: | ||||||||||||||||
| As a % of performing collateral | -7.37 | % | -19.48 | % | 33.21 | % | -12.77 | % | ||||||||
| As a % of performing collateral - adjusted for projected future defaults | -14.22 | % | -27.93 | % | 28.49 | % | -24.33 | % | ||||||||
| Other-than-temporary impairment model assumptions: | ||||||||||||||||
| Defaults: | ||||||||||||||||
| Year 1 - issuer average | 2.00 | % | 2.20 | % | 2.20 | % | 3.10 | % | ||||||||
| Year 2 - issuer average | 2.00 | % | 2.20 | % | 2.20 | % | 3.10 | % | ||||||||
| Year 3 - issuer average | 2.00 | % | 2.20 | % | 2.20 | % | 3.10 | % | ||||||||
| > 3 Years - issuer average | (1 | ) | (1 | ) | (1 | ) | (1 | ) | ||||||||
| Discount rate - 3 month Libor, plus implicit yield spread at purchase | 1.48 | % | 1.23 | % | 1.27 | % | 1.44 | % | ||||||||
| Recovery assumptions | (2 | ) | (2 | ) | (2 | ) | (2 | ) | ||||||||
| Prepayments | 0.00 | % | 0.00 | % | 0.00 | % | 0.00 | % | ||||||||
| Other-than-temporary impairment | $ | 41,100 | $ | 132,000 | $ | 36,600 | $ | 61,950 | ||||||||
(1) - Default rates > 3 years are evaluated on a issuer by issuer basis and range from 0.25% to 5.00%.
(2) - Recovery assumptions are evaluated on a issuer by issuer basis and range from 0% to 15% with a five year lag.
In the table above, the Bancorp’s subordination for each trust preferred security is calculated by taking the total performing collateral and subtracting the sum of the total collateral within the Bancorp’s class and the total collateral within all senior classes, and then stating this result as a percentage of the total performing collateral. This measure is an indicator of the level of collateral that can default before potential cash flow disruptions may occur. In addition, management calculates subordination assuming future collateral defaults by utilizing the default/deferral assumptions in the Bancorp’s other-than-temporary impairment analysis. Subordination assuming future default/deferral assumptions is calculated by deducting future defaults from the current performing collateral. At December 31, 2012, management reviewed the subordination levels for each security in context of the level of current collateral defaults and deferrals within each security; the potential for additional defaults and deferrals within each security; the length of time that the security has been in “payment in kind” status; and the Bancorp’s class position within each security.
Management calculated the other-than-temporary impairment model assumptions based on the specific collateral underlying each individual security. The following assumption methodology was applied consistently to each of the four pooled trust preferred securities: For collateral that has already defaulted, no recovery was assumed; no cash flows were assumed from collateral currently in deferral, with the exception of the recovery assumptions. The default and recovery assumptions were calculated based on the detailed collateral review. The discount rate assumption used in the calculation of the present value of cash flows is based on the discount margin (i.e., credit spread) at the time each security was purchased using the original purchase price. The discount margin is then added to the appropriate 3-month LIBOR forward rate obtained from the forward LIBOR curve.
At December 31, 2012, three of the trust preferred securities with a cost basis of $3.9 million have been placed in “payment in kind” status. The Bancorp’s securities that are classified as “payment in kind” are a result of not receiving the scheduled quarterly interest payments. For the securities in “payment in kind” status, management anticipates to receive the unpaid contractual interest payments from the issuer, because of the self correcting cash flow waterfall provisions within the structure of the securities. When a tranche senior to the Bancorp’s position fails the coverage test, the Bancorp’s interest cash flows are paid to the senior tranche and recorded as a reduction of principal. The coverage test represents an over collateralization target by stating the balance of the performing collateral as a percentage of the balance of the Bancorp’s tranche, plus the balance of all senior tranches. The principal reduction in the senior tranche continues until the appropriate coverage test is passed. As a result of the principal reduction in the senior tranche, more cash is available for future payments to the Bancorp’s tranche. Consistent with the Investments – Debt and Equity Securities Topic, management considered the failure of the issuer of the security to make scheduled interest payments in determining whether a credit loss existed. Management will not capitalize the “payment in kind” interest payments to the book value of the securities and will keep these securities in non-accrual status until the quarterly interest payments resume.
| (Dollars in thousands) | ||||||||||||||||
| Estimated Fair Value Measurements at December 31, 2012 Using | ||||||||||||||||
| Quoted Prices | Significant | |||||||||||||||
| in Active | Other | Significant | ||||||||||||||
| Markets for | Observable | Unobservable | ||||||||||||||
| December 31, | Identical Assets | Inputs | Inputs | |||||||||||||
| 2012 | (Level 1) | (Level 2) | (Level 3) | |||||||||||||
| Assets: | ||||||||||||||||
| Available-for-sale securities | ||||||||||||||||
| U.S. government sponsored entities | $ | 23,096 | $ | - | $ | 23,096 | $ | - | ||||||||
| CMO and residential mortgage-backed securities | 99,914 | - | 99,914 | - | ||||||||||||
| Municipal securities | 63,073 | - | 63,073 | - | ||||||||||||
| Collateralized debt obligations | 1,392 | - | - | 1,392 | ||||||||||||
| Total available-for-sale securities | $ | 187,475 | $ | - | $ | 186,083 | $ | 1,392 | ||||||||
| 41 |
| (Dollars in thousands) | ||||||||||||||||
| Estimated Fair Value Measurements at December 31, 2011 Using | ||||||||||||||||
| Quoted Prices | Significant | |||||||||||||||
| in Active | Other | Significant | ||||||||||||||
| Markets for | Observable | Unobservable | ||||||||||||||
| December 31, | Identical Assets | Inputs | Inputs | |||||||||||||
| 2011 | (Level 1) | (Level 2) | (Level 3) | |||||||||||||
| Assets: | ||||||||||||||||
| Available-for-sale securities | ||||||||||||||||
| U.S. government sponsored entities | $ | 15,648 | $ | - | $ | 15,648 | $ | - | ||||||||
| CMO and residential mortgage-backed securities | 111,197 | - | 111,197 | - | ||||||||||||
| Municipal securities | 58,756 | - | 58,756 | - | ||||||||||||
| Collateralized debt obligations | 1,361 | - | - | 1,361 | ||||||||||||
| Total available-for-sale securities | $ | 186,962 | $ | - | $ | 185,601 | $ | 1,361 | ||||||||
Reconciliation of available-for-sale securities, which require significant adjustment based on unobservable data, are presented below:
| (Dollars in thousands) | ||||
| Estimated Fair Value | ||||
| Measurements Using | ||||
| Significant Unobservable | ||||
| Inputs | ||||
| (Level 3) | ||||
| Available-for-sale | ||||
| securities | ||||
| Total realized/unrealized (losses)/gains, January 1, 2011 | 1,379 | |||
| Included in earnings | (1 | ) | ||
| Included in other comprehensive income | (17 | ) | ||
| Transfers in and/or (out) of Level 3 | - | |||
| Ending balance, December 31, 2011 | 1,361 | |||
| Total realized/unrealized (losses)/gains | ||||
| Included in earnings | (6 | ) | ||
| Included in other comprehensive income | 37 | |||
| Transfers in and/or (out) of Level 3 | - | |||
| Ending balance, December 31, 2012 | $ | 1,392 | ||
Assets and Liabilities Measured at Fair Values on a Non-Recurring Basis
Assets and liabilities measured at fair value on a non-recurring basis are summarized below:
| (Dollars in thousands) | ||||||||||||||||
| Estimated Fair Value Measurements at December 31, 2012 Using | ||||||||||||||||
| Quoted Prices | ||||||||||||||||
| in Active | Significant | |||||||||||||||
| Markets for | Other | Significant | ||||||||||||||
| Identical | Observable | Unobservable | ||||||||||||||
| December 31, | Assets | Inputs | Inputs | |||||||||||||
| 2012 | (Level 1) | (Level 2) | (Level 3) | |||||||||||||
| Assets: | ||||||||||||||||
| Impaired loans | $ | 17,879 | $ | - | $ | - | $ | 17,879 | ||||||||
| Foreclosed real estate | 425 | - | - | 425 | ||||||||||||
| (Dollars in thousands) | ||||||||||||||||
| Estimated Fair Value Measurements at December 31, 2011 Using | ||||||||||||||||
| Quoted Prices | ||||||||||||||||
| in Active | Significant | |||||||||||||||
| Markets for | Other | Significant | ||||||||||||||
| Identical | Observable | Unobservable | ||||||||||||||
| December 31, | Assets | Inputs | Inputs | |||||||||||||
| 2011 | (Level 1) | (Level 2) | (Level 3) | |||||||||||||
| Assets: | ||||||||||||||||
| Impaired loans | $ | 20,064 | $ | - | $ | - | $ | 20,064 | ||||||||
| Foreclosed real estate | 2,457 | - | - | 2,457 | ||||||||||||
The fair value of impaired loans with specific allocations of the allowance for loan losses or loans for which charge-offs have been taken is generally based on the present value of future cash flows or, for collateral dependent loans, based on recent real estate appraisals. Appraisals may utilize a single valuation approach or a combination of approaches, including comparable sales and the income approach. The unpaid principal balance of impaired loans was approximately $19.9 million and the related specific reserves totaled approximately $2.0 million, resulting in a fair value of impaired loans totaling approximately $17.9 million, at December 31, 2012. The unpaid principal balance of impaired loans was approximately $21.7 million and the related specific reserves totaled approximately $1.6 million, resulting in a fair value of impaired loans totaling approximately $20.1 million, at December 31, 2011. Fair value is determined, where possible, using market prices derived from an appraisal or evaluation, which are considered to be Level 2 inputs. However, certain assumptions and unobservable inputs are often used by the appraiser, therefore, qualifying the assets as Level 3 in the fair value hierarchy. The fair value of foreclosed real estate is similarly determined by using the results of recent real estate appraisals.
| 42 |
The following table shows carrying values and related estimated fair values of financial instruments as of the dates indicated. Estimated fair values are further categorized by the inputs used to measure fair value. Items that are not financial instruments are not included.
| (Dollars in thousands) | Estimated Fair Value Measurements at | |||||||||||||||||||
| December 31, 2012 | December 31, 2012 Using | |||||||||||||||||||
| Carrying Value | Estimated Fair Value | Quoted Prices in Active Markets for Identical Assets (Level 1) | Significant Other Observable Inputs (Level 2) | Significant Unobservable Inputs (Level 3) | ||||||||||||||||
| Financial assets: | ||||||||||||||||||||
| Cash and cash equivalents | $ | 33,751 | $ | 33,751 | $ | 33,751 | $ | - | $ | - | ||||||||||
| Securities available-for-sale | 187,475 | 187,475 | - | 186,083 | 1,392 | |||||||||||||||
| Loans held-for-sale | 323 | 332 | 332 | - | - | |||||||||||||||
| Loans receivable, net | 428,560 | 429,733 | - | - | 429,733 | |||||||||||||||
| Federal Home Loan Bank stock | 3,086 | 3,086 | - | 3,086 | - | |||||||||||||||
| Accrued interest receivable | 2,483 | 2,483 | - | 2,483 | - | |||||||||||||||
| Financial liabilities: | ||||||||||||||||||||
| Non-interest bearing deposits | 75,228 | 75,228 | 75,228 | - | - | |||||||||||||||
| Interest bearing deposits | 491,181 | 491,295 | 319,520 | 171,775 | - | |||||||||||||||
| Repurchase agreements | 16,298 | 16,310 | 10,131 | 6,179 | - | |||||||||||||||
| Borrowed funds | 33,207 | 33,658 | 207 | 33,451 | - | |||||||||||||||
| Accrued interest payable | 52 | 52 | - | 52 | - | |||||||||||||||
| (Dollars in thousands) | Estimated Fair Value Measurements at | |||||||||||||||||||
| December 31, 2011 | December 31, 2011 Using | |||||||||||||||||||
| Quoted Prices in | Significant | Significant | ||||||||||||||||||
| Active Markets for | Other Observable | Unobservable | ||||||||||||||||||
| Carrying | Estimated | Identical Assets | Inputs | Inputs | ||||||||||||||||
| Value | Fair Value | (Level 1) | (Level 2) | (Level 3) | ||||||||||||||||
| Financial assets: | ||||||||||||||||||||
| Cash and cash equivalents | $ | 26,367 | $ | 26,367 | $ | 26,367 | $ | - | $ | - | ||||||||||
| Securities available-for-sale | 186,962 | 186,962 | - | 185,601 | 1,361 | |||||||||||||||
| Loans held-for-sale | - | - | - | - | - | |||||||||||||||
| Loans receivable, net | 393,396 | 394,385 | - | - | 394,385 | |||||||||||||||
| Federal Home Loan Bank stock | 3,086 | 3,086 | - | 3,086 | - | |||||||||||||||
| Accrued interest receivable | 2,554 | 2,554 | - | 2,554 | - | |||||||||||||||
| Financial liabilities: | ||||||||||||||||||||
| Non-interest bearing deposits | 55,577 | 55,577 | 55,577 | - | - | |||||||||||||||
| Interest bearing deposits | 471,304 | 471,622 | 294,382 | 177,240 | - | |||||||||||||||
| Repurchase agreements | 15,395 | 15,407 | 8,722 | 6,685 | - | |||||||||||||||
| Borrowed funds | 36,618 | 37,270 | 617 | 36,653 | - | |||||||||||||||
| Accrued interest payable | 67 | 67 | - | 67 | - | |||||||||||||||
The following methods were used to estimate the fair value of financial instruments presented in the preceding table for the periods ended December 31, 2012 and 2011:
Cash and cash equivalent carrying amounts approximate fair value. The fair values of securities available-for-sale are obtained from broker pricing (Level 2), with the exception of collateralized debt obligations, which are valued by a third-party specialist (Level 3). Loans held-for-sale comprise residential mortgages and are priced based on values established by the secondary mortgage markets. The estimated fair value for net loans receivable is based on estimates of the rate the Bancorp would charge for similar such loans, applied for the time period until estimated repayment, in addition to appraisals which may utilize a single valuation approach or a combination of approaches including comparable sales and the income approach. Federal Home Loan Bank stock is estimated at book value due to restrictions that limit the sale or transfer of the security. Fair value of accrued interest receivable and payable approximates book value, as the carrying values are determined using the observable interest rate, balance, and last payment date.
| 43 |
Non-interest and interest bearing deposits, which include checking, savings, and money market deposits, are estimated to have fair values based on the amount payable as of the reporting date (Level 1). The fair value of fixed-maturity certificates of deposit (included in interest bearing deposits) are based on estimates of the rate the Bancorp would pay on similar deposits, applied for the time period until maturity (Level 2). Estimated fair values for short-term repurchase agreements, which represent sweeps from demand deposits to accounts secured by pledged securities, are estimated based on the amount payable as of the reporting date (Level 1). Longer-term repurchase agreements, with contractual maturity dates of three months or more, are based on estimates of the rate the Bancorp would pay on similar deposits, applied for the time period until maturity (Level 2). Short-term borrowings are generally only held overnight, therefore, their carrying amount is a reasonable estimate of fair value (Level 1). The fair value of FHLB Advances are estimated by discounting the future cash flows using quoted rates from the FHLB similar advances with similar maturities. The estimated fair value of other financial instruments, and off-balance sheet loan commitments, approximate cost and are not considered significant to this presentation.
Note 16 – Parent Company Only Statements
| (Dollars in thousands) | ||||||||
| NorthWest Indiana Bancorp | ||||||||
| Condensed Balance Sheets | ||||||||
| December 31, | ||||||||
| 2012 | 2011 | |||||||
| Assets | ||||||||
| Cash on deposit with Peoples Bank | $ | 1 | $ | 1,191 | ||||
| Investment in Peoples Bank | 67,321 | 62,601 | ||||||
| Dividends receivable from Peoples Bank | 539 | 425 | ||||||
| Other assets | 405 | 127 | ||||||
| Total assets | $ | 68,266 | $ | 64,344 | ||||
| Liabilities and stockholders’ equity | ||||||||
| Dividends payable | $ | 539 | $ | 425 | ||||
| Other liabilities | 76 | 959 | ||||||
| Total liabilities | 615 | 1,384 | ||||||
| Common stock | 361 | 361 | ||||||
| Additional paid in capital | 5,189 | 5,173 | ||||||
| Accumulated other comprehensive income | 2,339 | 2,536 | ||||||
| Retained earnings | 60,817 | 56,032 | ||||||
| Treasury stock | (1,055 | ) | (1,142 | ) | ||||
| Total stockholders’ equity | 67,651 | 62,960 | ||||||
| Total liabilities and stockholders’ equity | $ | 68,266 | $ | 64,344 | ||||
| (Dollars in thousands) | ||||||||
| NorthWest Indiana Bancorp | ||||||||
| Condensed Statements of Income | ||||||||
| Year Ended December 31, | ||||||||
| 2012 | 2011 | |||||||
| Dividends from Peoples Bank | $ | 2,044 | $ | 1,699 | ||||
| Operating expenses | 162 | 204 | ||||||
| Income before income taxes and equity in undistributed income of Peoples Bank | 1,882 | 1,495 | ||||||
| Income tax benefit | (52 | ) | (69 | ) | ||||
| Income before equity in undistributed income of Peoples Bank | 1,934 | 1,564 | ||||||
| Equity in undistributed income of Peoples Bank | 4,919 | 3,821 | ||||||
| Net income | $ | 6,853 | $ | 5,385 | ||||
| (Dollars in thousands) | ||||||||
| NorthWest Indiana Bancorp | ||||||||
| Condensed Statements of Cash Flows | ||||||||
| Year Ended December 31, | ||||||||
| 2012 | 2011 | |||||||
| Cash flows from operating activities: | ||||||||
| Net income | $ | 6,853 | $ | 5,385 | ||||
| Adjustments to reconcile net income to | ||||||||
| net cash provided by operating activities | ||||||||
| Equity in undistributed net income of Peoples Bank | (5,071 | ) | (4,139 | ) | ||||
| Deferred tax expense/(benefit) | 152 | 318 | ||||||
| Stock based compensation expense | 16 | 33 | ||||||
| Change in other assets | (392 | ) | (23 | ) | ||||
| Change in other liabilities | (883 | ) | 99 | |||||
| Total adjustments | (6,178 | ) | (3,712 | ) | ||||
| Net cash - operating activities | 675 | 1,673 | ||||||
| Cash flows from investing activities | - | - | ||||||
| Cash flows from financing activities: | ||||||||
| Dividends paid | (1,928 | ) | (1,699 | ) | ||||
| Treasury stock purchased | (78 | ) | - | |||||
| Proceeds from sale of treasury stock | 141 | 124 | ||||||
| Net cash - financing activities | (1,865 | ) | (1,575 | ) | ||||
| Net change in cash | (1,190 | ) | 98 | |||||
| Cash at beginning of year | 1,191 | 1,093 | ||||||
| Cash at end of year | $ | 1 | $ | 1,191 | ||||
| 44 |
Market Information |
The Bancorp’s Common Stock is traded in the over-the-counter market and quoted on the OTC Bulletin Board. The Bancorp’s stock is not actively traded. As of January 31, 2013, the Bancorp had 2,837,396 shares of common stock outstanding and 405 stockholders of record. This does not reflect the number of persons or entities who may hold their stock in nominee or “street” name through brokerage firms. Set forth below are the high and low bid prices during each quarter for the years ended December 31, 2012 and December 31, 2011. The bid prices reflect inter-dealer prices without retail mark-up, mark-down or commission and may not necessarily represent actual transactions. Also set forth is information concerning the dividends declared by the Bancorp during the periods reported. Note 10 to the Financial Statements describes regulatory limits on the Bancorp’s ability to pay dividends.
| Dividends | ||||||||||||
| Per Share Prices | Declared Per | |||||||||||
| High | Low | Common Share | ||||||||||
| Year Ended | ||||||||||||
| December 31, 2012 1st Quarter | $ | 20.00 | $ | 13.25 | $ | 0.15 | ||||||
| 2nd Quarter | 20.00 | 18.30 | 0.19 | |||||||||
| 3rd Quarter | 19.25 | 18.50 | 0.19 | |||||||||
| 4th Quarter | 21.00 | 17.58 | 0.19 | |||||||||
| Year Ended | ||||||||||||
| December 31, 2011 1st Quarter | $ | 16.75 | $ | 14.00 | $ | 0.15 | ||||||
| 2nd Quarter | 15.10 | 13.70 | 0.15 | |||||||||
| 3rd Quarter | 15.00 | 14.00 | 0.15 | |||||||||
| 4th Quarter | 15.50 | 14.00 | 0.15 | |||||||||
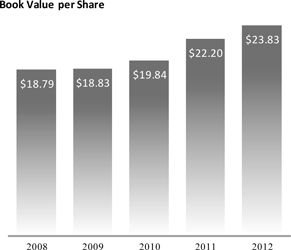
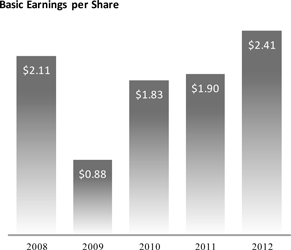
| 45 |
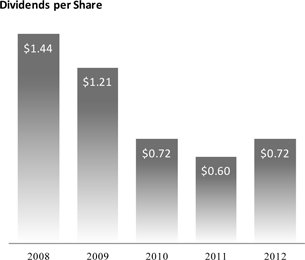
| 46 |