
2013 Annual Report

Dear Shareholder:
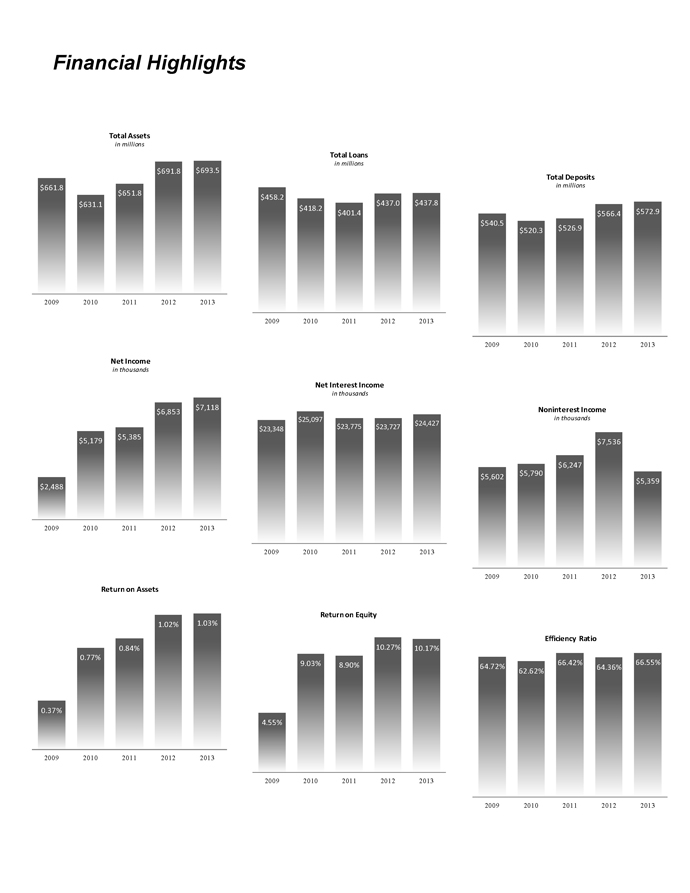
In 2013, the Peoples team executed at a high level and delivered another year of stellar performance. We reported record earnings of $7.1 million which surpassed last year’s record of $6.9 million. Highlights of the year included a strong capital position, improved asset quality, enhanced electronic delivery channels, expansion through a pending bank acquisition, and the successful execution of banking fundamentals and a management succession plan. Investors reacted well to our progress as the price of your stock rose steadily throughout the year.
As the economy and banking industry recover from the lingering effects of the Great Recession, our strategic plan has let us emerge from the storm stronger than ever to take advantage of opportunities for creating shareholder value in a consolidating industry. Our strategic vision is clear: we will remain an independent bank with sustained core earnings that will drive asset growth and result in the Bancorp reaching a larger scale. Growth will not be pursued for its own sake; but rather to help the Bancorp absorb increased regulatory and operational costs, reinvest in growing our core business, and continue to deliver an exceptional experience to our customers.
2013 Achievements
Strong Capital Position – Because of our balance sheet strategy, we attained our strongest capital position since the onset of the Great Recession. At the end of the year, stockholders equity stood at 9.6% of total assets with our Tier 1 regulatory ratio at 10.0% and our Total Risk Based regulatory ratio at 15.6%. As a result, the Bancorp is well positioned to pursue strategies that will provide greater economic growth in our community and financial security for our customers. We have the earnings record and capital to expand our footprint, increase the outreach of our loan production to consumers and small business, and invest in technology-driven delivery channels in response to changing customer banking preferences.
Improved Asset Quality – The last several years challenged the banking industry’s ability to maintain strong asset quality; and the Bancorp was no exception. Our loan work-out team, headed by Chief Lending Officer Todd Scheub, endeavored throughout the year with great success to reduce our non-performing loans to normal levels. The results are nearly without parallel among community banks, as our ratio of non-performing loans to total loans declined from 2.63% at the end of 2012 to .90% at the end of December 2013. Consequently, our non-performing loan ratio fell to levels not seen since the beginning of the recession, permitting the Bancorp to reduce our loan loss provision expense during the year.
Electronic Banking – For today’s customer, the best technology provides the most value to the customer’s banking experience. Your Bank offers customer banking technology that rivals the biggest banks in the country and we deliver for our customers on the strength of our team. The Bancorp will continue to invest in technologies that streamline processes and enhance the customer experience. Our technology enhancements were ambitious, consistent with our belief that the Bank has to be positioned today for the increased electronic banking demands of tomorrow’s customers. The goal of these investments is to empower customers to focus on financial needs, not process. Similarly, our goal is to empower our team members with technology to engage our customers and not focus on process. Our customer surveys show that our electronic and mobile banking efforts have met with success as we have attracted new and younger customers and households to our customer base.
| 1 |
Banking Fundamentals – The Bancorp does not stray from the fundamentals of banking. We keep an eye on the bottom line by watching our expenses, maintaining our core earnings by growing core accounts, and diversifying income through expansion of our Wealth Management products and services. Like the customers and households we serve, we tightened our belts this year and reduced operating expenses by $298 thousand while continuing to make smart investments that drive the Bank’s strategic plan.
Focusing on the fundamentals of banking has consistently resulted in high returns to our shareholders as measured by key banking performance metrics. We are pleased that our results received national recognition during the year as the NorthWest Indiana Bancorp again was named one of the top 200 Community Banks in America by U.S. Banker magazine. This award is based upon the three-year average return on equity (ROE) of publicly traded community banks.
Maintaining our core earnings, or net interest margin, is highly dependent on our ability to grow core deposits. For the Bancorp, this means growing our checking, savings, and money market accounts in order to maintain a low cost of funding. Combined, these accounts grew 5.7% or $22.5 million, and at year-end represented 72.8% of the Bancorp’s deposit base.
Consumers have shown a growing demand throughout the nation for banking as well as investment and fiduciary services. To meet this growing demand as well as to diversify our income sources, the Bancorp established a Wealth Management Group to serve the growing financial needs of our customers. Again this year, Wealth Management operations increased their income by over 10%, and at year-end the market value of assets under management was $266.9 million.
Expanding Our Footprint – Your Board of Directors and Management Team understand that the landscape of the banking industry is changing, both locally and nationally. As banks consolidate, the Bancorp strives to be on “offense” and on the buy side of the equation in order to remain independent.
Over the years, we have looked at a number of such opportunities with our analysis determining that the targets were not a good fit each time. That changed in the last quarter of 2013 as we announced the acquisition, subject to regulatory approvals, of First Federal Savings and Loan of Hammond; a small but important first step to achieving a larger scale.
The transaction is a unique voluntary supervisory merger conversion that will add $38 million in assets and two banking center locations with minimal expense to the Bancorp. No cash or shares will be paid in the acquisition, with our costs limited mainly to the accounting and legal fees of the transaction. This deal will be accretive to earnings in 2014 and final regulatory approval is expected by the end of the first quarter of 2014.
| 2 |
Management Succession – The goal of our management succession plan is to build a strong forward looking management team capable of leading the successful implementation of the Bancorp’s strategic plan and continuing our tradition of outstanding performance.
Our Senior Management group has demonstrated exceptional experience and achievements, and collectively has over two hundred years of banking experience. Internally, they operate under the title of the G-10; and beginning in 2012, they took responsibility for mapping the strategic direction of the Bancorp and executing the plan under the leadership of Ben Bochnowski. Despite the economic stress and slow recovery of the past few years, the G-10 produced a Board-approved plan that resulted in record earnings in 2012 and 2013.
The Board initiated an independent and rigorous review of the long-term leadership requirements of the Bancorp that included the attributes and skill sets an individual must possess to lead a community bank. These included vision, honesty, integrity, communication, passion and commitment, initiative, teamwork, organization skills, time management, and the ability to focus on priorities.
As a next step in the Bancorp’s succession plan, the Board’s outside Directors unanimously agreed to promote Ben Bochnowski to the position of Chief Operating Officer (COO) of the Bancorp and Peoples Bank. This position leads the execution of the strategic plan and provides oversight for day-to-day banking activities with all operating units of the Bancorp reporting directly to the COO. The COO coordinates with the Chairman and CEO in the overall administration of the Bancorp and Bank.
The Board recognized Ben’s vision, talent, and passion for community banking along with his proven track record of performance. He becomes the fourth generation of the Bochnowski family to serve the Bank’s stakeholders, and he will uphold the Bank’s ongoing commitment to help consumers and small business owners achieve their financial goals. As a part of his new role, Ben will join me as a co-writer of next year’s annual report.
NWIN Performance
At the end of December 2013, your stock in the NorthWest Indiana Bancorp (NWIN) had a closing price of $25.00 per share, an increase of 30.9% over the closing price of $19.10 a year earlier. The Bancorp’s performance permitted your Directors to increase your dividend per share from $.19 per share to $.22 per share, an increase of 15.7%. The Monroe Securities Chicago Area Trading Multiples Report for the fourth quarter of 2013 listed 25 companies including NWIN. According to this report, seven of these companies were paying a dividend to their shareholders, and the highest dividend yield came from your company, NWIN, at 3.5%.
| 3 |
2014 Opportunities
The Bancorp’s franchise is built upon three pillars: asset growth, funding growth and income growth. Supporting these pillars is Enterprise Risk Management (ERM), a system that serves to ensure that value from pursuit of opportunities presented by each pillar is realized safely. Executing ERM is the responsibility of every member of the Peoples team in support of achieving the desired outcome of our strategic initiatives.
2013 was a highly successful year with earnings bolstered by the favorable disposition of several problem loans. The resolution of one of those credits resulted in the collection of $1.4 million in back interest which improved our interest income last year. That advantageous outcome will not be repeated this year, and the Bancorp will be challenged to safely and soundly ensure the replacement of that income source without stressing our commitment to the principles of ERM.
I’m pleased to report that your Bank was named one of the 2013 Best Places to Work in Indiana, based on results of surveys of our employees and employment practices conducted by Best Companies Group. Along with our customers, our employees are the Bank’s most valuable assets and we remain committed to providing a dynamic and positive work environment.
During 2013, the Bancorp recruited several experienced business bankers and mortgage lenders who have been tasked with engaging our customers to safely and soundly enhance our loan originations. These seasoned professionals have been added to the mix of our experienced lenders and we are optimistic that their combined ability will increase income from loan balances that will grow as the economic recovery takes hold.
The Bancorp will continue its commitment to growing our core deposits as an essential ingredient to maintaining a reliable, low-cost source of funding for the Bancorp’s growth. Success hinges on having the right products and ensuring that the Bancorp has traditional as well as electronic channels to efficiently deliver those products to our customers. This year we will continue to sharpen our banking processes so that we have more time to devote to customer relationship-building and engagement.
Growing our Wealth Management group will continue to be a driver of our effort to create a diversified source of income. By adding well trained professionals to our staff and re-energizing our delivery of wealth management products and services, Wealth Management will provide our customers the value as well as the resources to help them reach their financial goals. Effectively scaling up our wealth management line of business also will create value for our shareholders through increased income from products and services.
This year, the Bancorp is again committed to carefully reviewing our expense structure while recognizing that in order to drive future growth, we need to make investments for the future. It continues to be incumbent on the Bancorp to grow efficiently so that revenue growth outpaces expense growth, which was a key achievement for 2013. Expense management strategies will be utilized to drive efficient operations so that the Bancorp can invest in growing our business.
| 4 |
A Personal Note
With much happiness, it is my pleasure to inform you that in the latter part of January 2014, my medical team concluded that the treatments for multiple myeloma that was diagnosed in late May of 2013 were a complete success. My prior condition, which stems from exposure to Agent Orange, a highly toxic defoliant, during my tour of duty in Vietnam some 43 years ago, is in complete remission and I am cancer free. The power of modern medicine as practiced by the professionals at Community Hospital in Munster, especially Dr. Erwin Robin, and the Stem Cell Transplant Team of Dr. Jayesh Mehta of Northwestern University Hospital in Chicago, along with the Grace of God, deserve the credit for my favorable outcome. The outpouring of support from my family, the Peoples family, and friends has been a humbling experience. I am grateful for your prayers and shall always cherish the difference so many of you made during this experience.
On behalf of your Directors and the entire Peoples team, I thank you for your continuing support of the Bancorp and encourage you to refer your family, friends, and business associates to us to fulfill their lending and financial needs.
| Sincerely, | |
 | |
| David A. Bochnowski | |
| Chairman and Chief Executive Officer |
| 5 |
Selected Consolidated Financial Data
in thousands of dollars, except per share data
| Fiscal Year Ended | December 31, | December 31, | December 31, | December 31, | December 31, | December 31, | December 31, | December 31, | December 31, | December 31, | ||||||||||||||||||||||||||||||
| 2013 | 2012 | 2011 | 2010 | 2009 | 2008 | 2007 | 2006 | 2005 | 2004 | |||||||||||||||||||||||||||||||
| Statement of Income: | ||||||||||||||||||||||||||||||||||||||||
| Total interest income | $ | 26,157 | $ | 26,075 | $ | 26,986 | $ | 30,086 | $ | 32,189 | $ | 35,167 | $ | 35,768 | $ | 34,979 | $ | 30,024 | $ | 26,614 | ||||||||||||||||||||
| Total interest expense | 1,730 | 2,348 | 3,231 | 4,989 | 8,841 | 12,933 | 17,882 | 15,737 | 9,758 | 6,858 | ||||||||||||||||||||||||||||||
| Net interest income | 24,427 | 23,727 | 23,755 | 25,097 | 23,348 | 22,234 | 17,886 | 19,242 | 20,266 | 19,756 | ||||||||||||||||||||||||||||||
| Provision for loan losses | 450 | 2,350 | 3,510 | 5,570 | 8,540 | 2,388 | 552 | 15 | 245 | 385 | ||||||||||||||||||||||||||||||
| Net interest income after provision for loan losses | 23,977 | 21,377 | 20,245 | 19,527 | 14,808 | 19,846 | 17,334 | 19,227 | 20,021 | 19,371 | ||||||||||||||||||||||||||||||
| Noninterest income | 5,359 | 7,536 | 6,247 | 5,790 | 5,602 | 4,528 | 4,431 | 4,219 | 3,540 | 3,312 | ||||||||||||||||||||||||||||||
| Noninterest expense | 19,821 | 20,119 | 19,928 | 19,341 | 18,735 | 16,999 | 14,525 | 14,296 | 13,771 | 13,174 | ||||||||||||||||||||||||||||||
| Net noninterest expense | 14,462 | 12,583 | 13,681 | 13,551 | 13,133 | 12,471 | 10,094 | 10,077 | 10,231 | 9,862 | ||||||||||||||||||||||||||||||
| Income tax expenses/(benefit) | 2,397 | 1,941 | 1,179 | 797 | (813 | ) | 1,445 | 1,651 | 2,674 | 3,118 | 3,219 | |||||||||||||||||||||||||||||
| Cumulative effect of changes in accounting | - | - | - | - | - | - | - | - | - | - | ||||||||||||||||||||||||||||||
| Net income | $ | 7,118 | $ | 6,853 | $ | 5,385 | $ | 5,179 | $ | 2,488 | $ | 5,930 | $ | 5,589 | $ | 6,475 | $ | 6,672 | $ | 6,290 | ||||||||||||||||||||
| Basic earnings per common share | $ | 2.50 | $ | 2.41 | $ | 1.90 | $ | 1.83 | $ | 0.88 | $ | 2.11 | $ | 1.99 | $ | 2.32 | $ | 2.40 | $ | 2.28 | ||||||||||||||||||||
| Diluted earnings per common share | $ | 2.50 | $ | 2.41 | $ | 1.90 | $ | 1.83 | $ | 0.88 | $ | 2.10 | $ | 1.98 | $ | 2.30 | $ | 2.37 | $ | 2.24 | ||||||||||||||||||||
| Cash dividends declared per common share | $ | 0.85 | $ | 0.72 | $ | 0.60 | $ | 0.72 | $ | 1.21 | $ | 1.44 | $ | 1.44 | $ | 1.40 | $ | 1.32 | $ | 1.24 | ||||||||||||||||||||
| December 31, | December 31, | December 31, | December 31, | December 31, | December 31, | December 31, | December 31, | December 31, | December 31, | |||||||||||||||||||||||||||||||
| 2013 | 2012 | 2011 | 2010 | 2009 | 2008 | 2007 | 2006 | 2005 | 2004 | |||||||||||||||||||||||||||||||
| Balance Sheet: | ||||||||||||||||||||||||||||||||||||||||
| Total assets | $ | 693,453 | $ | 691,845 | $ | 651,758 | $ | 631,053 | $ | 661,017 | $ | 664,732 | $ | 628,718 | $ | 617,518 | $ | 627,439 | $ | 557,393 | ||||||||||||||||||||
| Loans receivable | 437,821 | 436,981 | 401,401 | 418,233 | 458,245 | 489,509 | 468,459 | 471,716 | 469,043 | 433,790 | ||||||||||||||||||||||||||||||
| Investment securities | 194,296 | 187,475 | 186,962 | 160,452 | 144,333 | 126,722 | 114,644 | 99,012 | 79,979 | 79,979 | ||||||||||||||||||||||||||||||
| Deposits | 572,893 | 566,409 | 526,881 | 520,271 | 540,527 | 528,148 | 512,931 | 512,931 | 525,731 | 451,573 | ||||||||||||||||||||||||||||||
| Borrowed funds | 44,929 | 49,505 | 52,013 | 48,618 | 63,022 | 74,795 | 76,930 | 51,501 | 51,152 | 57,201 | ||||||||||||||||||||||||||||||
| Total stockholders' equity | 66,761 | 67,651 | 62,960 | 56,089 | 53,078 | 52,773 | 52,733 | 49,902 | 46,433 | 44,097 | ||||||||||||||||||||||||||||||
| December 31, | December 31, | December 31, | December 31, | December 31, | December 31, | December 31, | December 31, | December 31, | December 31, | |||||||||||||||||||||||||||||||
| 2013 | 2012 | 2011 | 2010 | 2009 | 2008 | 2007 | 2006 | 2005 | 2004 | |||||||||||||||||||||||||||||||
| Interest Rate Spread During Period: | ||||||||||||||||||||||||||||||||||||||||
| Average effective yield on loans and investment securities | 4.03 | % | 4.14 | % | 4.50 | % | 4.84 | % | 5.16 | % | 5.78 | % | 6.21 | % | 6.02 | % | 5.49 | % | 5.31 | % | ||||||||||||||||||||
| Average effective cost of deposits and borrowings | 0.28 | % | 0.39 | % | 0.56 | % | 0.82 | % | 1.45 | % | 2.19 | % | 3.18 | % | 2.77 | % | 1.82 | % | 1.40 | % | ||||||||||||||||||||
| Interest rate spread | 3.75 | % | 3.75 | % | 3.94 | % | 4.02 | % | 3.71 | % | 3.59 | % | 3.03 | % | 3.25 | % | 3.67 | % | 3.91 | % | ||||||||||||||||||||
| Net interest margin | 3.77 | % | 3.77 | % | 3.96 | % | 4.04 | % | 3.74 | % | 3.65 | % | 3.10 | % | 3.31 | % | 3.71 | % | 3.94 | % | ||||||||||||||||||||
| Return on average assets | 1.03 | % | 1.02 | % | 0.84 | % | 0.77 | % | 0.37 | % | 0.91 | % | 0.91 | % | 1.04 | % | 1.14 | % | 1.17 | % | ||||||||||||||||||||
| Return on average equity | 10.17 | % | 10.27 | % | 8.90 | % | 9.03 | % | 4.55 | % | 10.96 | % | 10.78 | % | 13.42 | % | 14.67 | % | 14.64 | % | ||||||||||||||||||||
| December 31, | December 31, | December 31, | December 31, | December 31, | December 31, | December 31, | December 31, | December 31, | December 31, | |||||||||||||||||||||||||||||||
| 2013 | 2012 | 2011 | 2010 | 2009 | 2008 | 2007 | 2006 | 2005 | 2004 | |||||||||||||||||||||||||||||||
| Tier 1 capital to risk-weighted assets | 15.6 | % | 14.6 | % | 14.3 | % | 12.9 | % | 11.5 | % | 12.0 | % | 12.0 | % | 11.1 | % | 10.7 | % | 11.2 | % | ||||||||||||||||||||
| Total capital to risk-weighted assets | 14.3 | % | 13.4 | % | 13.1 | % | 11.7 | % | 10.3 | % | 10.8 | % | 11.0 | % | 12.1 | % | 11.6 | % | 12.2 | % | ||||||||||||||||||||
| Tier 1 capital leverage ratio | 10.0 | % | 9.4 | % | 9.2 | % | 8.5 | % | 7.8 | % | 8.2 | % | 8.3 | % | 8.0 | % | 7.9 | % | 8.0 | % | ||||||||||||||||||||
| Allowance for loan losses to total loans | 1.64 | % | 1.93 | % | 1.99 | % | 2.18 | % | 1.33 | % | 1.19 | % | 0.98 | % | 0.90 | % | 0.89 | % | 0.90 | % | ||||||||||||||||||||
| Allowance for loan losses to non-performing loans | 181.81 | % | 73.34 | % | 56.03 | % | 37.82 | % | 32.93 | % | 46.97 | % | 53.16 | % | 153.95 | % | 198.00 | % | 371.00 | % | ||||||||||||||||||||
| Non-performing loans to total loans | 0.90 | % | 2.63 | % | 3.56 | % | 5.77 | % | 4.05 | % | 2.54 | % | 1.02 | % | 0.58 | % | 0.45 | % | 0.24 | % | ||||||||||||||||||||
| Total loan accounts | 4,416 | 4,416 | 4,567 | 4,594 | 4,846 | 5,193 | 5,268 | 5,422 | 5,370 | 5,213 | ||||||||||||||||||||||||||||||
| Total deposit accounts | 27,970 | 27,790 | 28,303 | 28,912 | 32,616 | 33,692 | 30,760 | 33,963 | 32,866 | 32,502 | ||||||||||||||||||||||||||||||
| Total branches (all full service) | 12 | 12 | 12 | 12 | 11 | 10 | 9 | 8 | 8 | 8 | ||||||||||||||||||||||||||||||
(1) Includes the $1.6 million one-time special assessment on FDIC-assessable deposits to recapitalize SAIF.
| 6 |
Business
NorthWest Indiana Bancorp (the Bancorp) is a bank holding company registered with the Board of Governors of the Federal Reserve System. Peoples Bank (the Bank), an Indiana bank, is a wholly owned subsidiary of the Bancorp. The Bancorp has no other business activity other than being the holding company for the Bank.
The Bancorp conducts business from its Corporate Center in Munster and its twelve full-service offices located in Crown Point, Dyer, East Chicago, Gary, Hammond, Hobart, Merrillville, Munster, St. John, Schererville, and Valparaiso, Indiana. The Bancorp is primarily engaged in the business of attracting deposits from the general public and the origination of loans secured by single family residences and commercial real estate, as well as, construction loans, various types of consumer loans and commercial business loans, and loans to local municipalities. In addition, the Bancorp's Wealth Management Group provides estate and retirement planning, guardianships, land trusts, profit sharing and 401(k) retirement plans, IRA and Keogh accounts, and investment agency accounts. The Wealth Management Group may also serve as the personal representative of estates and act as trustee for revocable and irrevocable trusts.
The Bancorp's common stock is traded in the over-the-counter market and is quoted on the OTC Bulletin Board. On January 31, 2014, the Bancorp had 2,841,164 shares of common stock outstanding and 407 stockholders of record. This does not reflect the number of persons or entities who may hold their stock in nominee or "street" name through brokerage firms.
| 7 |
Management’s Discussion and Analysis of
Financial Condition and Results of Operations
General
The Bancorp's earnings are dependent upon the earnings of the Bank. The Bank's earnings are primarily dependent upon net interest margin. The net interest margin is the difference between interest income earned on loans and investments and interest expense paid on deposits and borrowings stated as a percentage of average interest earning assets. The net interest margin is perhaps the clearest indicator of a financial institution's ability to generate core earnings. Fees and service charges, wealth management operations income, gains and losses from the sale of assets, provisions for loan losses, income taxes and operating expenses also affect the Bancorp's profitability.
A summary of the Bancorp’s significant accounting policies is detailed in Note 1 to the Bancorp’s consolidated financial statements included in this report. The preparation of our financial statements requires management to make estimates and assumptions that affect our financial condition and operating results. Actual results could differ from those estimates. Estimates associated with the allowance for loan losses, fair values of foreclosed real estate, financial instruments and status of contingencies are particularly susceptible to material change in the near term as further information becomes available and future events occur.
At December 31, 2013, the Bancorp had total assets of $693.5 million and total deposits of $572.9 million. The Bancorp's deposit accounts are insured up to applicable limits by the Deposit Insurance Fund (DIF) that is administered by the Federal Deposit Insurance Corporation (FDIC), an agency of the federal government. At December 31, 2013, stockholders' equity totaled $66.8 million, with book value per share at $23.50. Net income for 2013 was $7.1 million, or $2.50 basic and diluted earnings per common share. The return on average assets was 1.03%, while the return on average stockholders’ equity was 10.17%.
Recent Developments
The Current Economic and Regulatory Environment. We continue to operate in an uncertain economic and regulatory environment, which presents risks associated with our business. In this regard, the 2010 Dodd-Frank Wall Street Reform and Consumer Protection Act (the "Dodd-Frank Act") contains comprehensive provisions governing the practices and oversight of large and small financial institutions alike, including several provisions that profoundly affect the regulation of community banks, thrifts, and small bank and thrift holding companies, such as the Bancorp. The Dodd-Frank Act also established a new financial regulator, the Consumer Financial Protection Bureau (the "CFPB"), which has broad authority to regulate consumer financial products and services and entities offering such products and services, including banks. Additional legislative or regulatory action that may impact our business may result from the numerous provisions and multiple studies mandated under the Dodd-Frank Act.
The evolving regulatory environment causes uncertainty with respect to the manner in which we conduct our business and requirements that may be imposed by our regulators. Regulators have implemented and continue to propose new regulations and supervisory guidance and have been increasing their examination and enforcement action activities. We expect that regulators will continue taking formal enforcement actions against financial institutions in addition to addressing supervisory concerns through non-public supervisory actions or criticisms. We are unable to predict the nature, extent or impact of any additional changes to statutes or regulations, including the interpretation, implementation or enforcement thereof, that may occur in the future.
The impact of the evolving regulatory environment on our business and operations depends upon final implementing regulations and guidance issued by the regulatory agencies, the actions of our competitors, and other marketplace participants, and the behavior of consumers. Regulatory actions could require us to limit or change our business practices, limit our ability to pursue business opportunities, limit our product offerings, require continued investment of management time and resources in compliance efforts, limit fees we can charge for services, require us to meet more stringent capital, liquidity, and leverage ratio requirements (including those under Basel III, as discussed below), increase costs, impact the value of our assets, or otherwise adversely affect our business.
Compliance and other regulatory requirements and expenditures have increased for the Bancorp and other financial institutions, and we expect them to continue to increase as regulators adopt new rules and increase their scrutiny of financial institutions, including controls and operational processes. The additional expense, time, and resources needed to comply with ongoing regulatory requirements may impact our business and results of operations.
New Capital Rules. On July 2, 2013, the Federal Reserve approved final rules that substantially amend the regulatory risk-based capital rules applicable to the Bancorp and the Bank. The FDIC and the Office of the Comptroller of the Currency (“OCC”) have subsequently approved these rules. The final rules were adopted following the issuance of proposed rules by the Federal Reserve in June 2012, and implement the “Basel III” regulatory capital reforms and changes required by the Dodd-Frank Act. “Basel III” refers to two consultative documents released by the Basel Committee on Banking Supervision in December 2009, the rules text released in December 2010, and loss absorbency rules issued in January 2011, which include significant changes to bank capital, leverage and liquidity requirements.
| 8 |
The rules include new risk-based capital and leverage ratios, which would be phased in from 2015 to 2019, and would refine the definition of what constitutes “capital” for purposes of calculating those ratios. The new minimum capital level requirements applicable to the Bancorp and the Bank under the final rules would be: (i) a new common equity Tier 1 capital ratio of 4.5%; (ii) a Tier 1 capital ratio of 6% (increased from 4%); (iii) a total capital ratio of 8% (unchanged from current rules); and (iv) a Tier 1 leverage ratio of 4% for all institutions. The final rules also establish a “capital conservation buffer” above the new regulatory minimum capital requirements, which must consist entirely of common equity Tier 1 capital. The capital conservation buffer will be phased-in over four years beginning on January 1, 2016, as follows: the maximum buffer will be 0.625% of risk-weighted assets for 2016, 1.25% for 2017, 1.875% for 2018, and 2.5% for 2019 and thereafter. This will result in the following minimum ratios beginning in 2019: (i) a common equity Tier 1 capital ratio of 7.0%, (ii) a Tier 1 capital ratio of 8.5%, and (iii) a total capital ratio of 10.5%. Under the final rules, institutions are subject to limitations on paying dividends, engaging in share repurchases, and paying discretionary bonuses if its capital level falls below the buffer amount. These limitations establish a maximum percentage of eligible retained income that could be utilized for such actions.
Basel III provided discretion for regulators to impose an additional buffer, the “countercyclical buffer,” of up to 2.5% of common equity Tier 1 capital to take into account the macro-financial environment and periods of excessive credit growth. However, the final rules permit the countercyclical buffer to be applied only to “advanced approach banks” (i.e. , banks with $250 billion or more in total assets or $10 billion or more in total foreign exposures), which currently excludes the Bancorp and the Bank. The final rules also implement revisions and clarifications consistent with Basel III regarding the various components of Tier 1 capital, including common equity, unrealized gains and losses, as well as certain instruments that will no longer qualify as Tier 1 capital, some of which will be phased out over time. However, the final rules provide that small depository institution holding companies with less than $15 billion in total assets as of December 31, 2009 (which includes the Bancorp) will be able to permanently include non-qualifying instruments that were issued and included in Tier 1 or Tier 2 capital prior to May 19, 2010 in additional Tier 1 or Tier 2 capital until they redeem such instruments or until the instruments mature.
The final rules also contain revisions to the prompt corrective action framework, which is designed to place restrictions on insured depository institutions, including the Bank, if their capital levels begin to show signs of weakness. These revisions take effect January 1, 2015. Under the prompt corrective action requirements, which are designed to complement the capital conservation buffer, insured depository institutions will be required to meet the following increased capital level requirements in order to qualify as “well capitalized:” (i) a new common equity Tier 1 capital ratio of 6.5%; (ii) a Tier 1 capital ratio of 8% (increased from 6%); (iii) a total capital ratio of 10% (unchanged from current rules); and (iv) a Tier 1 leverage ratio of 5% (increased from 4%).
The final rules set forth certain changes for the calculation of risk-weighted assets, which we will be required to utilize beginning January 1, 2015. The standardized approach final rule utilizes an increased number of credit risk exposure categories and risk weights, and also addresses: (i) an alternative standard of creditworthiness consistent with Section 939A of the Dodd-Frank Act; (ii) revisions to recognition of credit risk mitigation; (iii) rules for risk weighting of equity exposures and past due loans; (iv) revised capital treatment for derivatives and repo-style transactions; and (v) disclosure requirements for top-tier banking organizations with $50 billion or more in total assets that are not subject to the “advance approach rules” that apply to banks with greater than $250 billion in consolidated assets. Based on our current capital composition and levels, we believe that we would be in compliance with the requirements as set forth in the final rules if they were presently in effect.
Acquisition Activity. On December 20, 2013, the Bank signed a definitive agreement to acquire First Federal Savings and Loan Association of Hammond (the “Association”), a federal mutual savings association headquartered in Hammond, Indiana. The Bank will acquire the Association by merging the Association with and into the Bank immediately following the Association’s voluntary supervisory conversion from mutual to stock form. Neither the Bancorp nor the Bank will issue or pay any shares, cash, or other consideration in the merger. The Bank’s acquisition of the Association is subject to customary closing conditions, including regulatory approvals by the OCC, FDIC, and DFI. No approval of the members of the Association is required for the transaction. The Bank and the Association make certain customary representations and warranties in the definitive acquisition agreement, which will terminate at the closing. The Association has a home office and branch office in Lake County, Indiana, and is expected to add approximately $40.7 million in assets to the Bank, based on the Association’s September 30, 2013 financial statements. The merger is expected to close in the second quarter of 2014.
| 9 |
Financial Condition
During the year ended December 31, 2013, total assets increased by $1.6 million (0.2%), to $693.5 million, with interest-earning assets decreasing by $8.4 million (1.3%). At December 31, 2013, interest-earning assets totaled $644.7 million and represented 93.0% of total assets. Loans totaled $437.8 million and represented 67.9% of interest-earning assets, 63.1% of total assets and 76.4% of total deposits. The loan portfolio, which is the Bancorp’s largest asset, is a significant source of both interest and fee income. The Bancorp’s lending strategy emphasizes quality growth, product diversification, and competitive and profitable pricing. The loan portfolio includes $161.9 million (36.9%) in residential real estate loans, $144.4 million (33.0%) in commercial real estate loans, $57.8 million (13.2%) in commercial business loans, $30.8 million (7.0%) in multifamily loans, $21.5 million (4.9%) in construction and land development loans, $21.6 million (4.9%) in government and other loans, and $237 thousand (0.1%) in consumer loans. Adjustable rate loans comprised 59.7% of total loans at year-end. During 2013, loan balances increased by $840 thousand (0.2%), with government, residential real estate, and home equity line of credit balances increasing while commercial business, commercial real estate, construction and land development, and multifamily balances decreased. The increase in loans during the year is the result of improving credit and economic conditions.
The Bancorp is primarily a portfolio lender. Mortgage banking activities historically have been limited to the sale of fixed rate mortgage loans with contractual maturities greater than 15 years. However, during 2012, as a result of the low interest rate environment, management began selling some newly originated fixed rate mortgage loans with contractual maturities greater than 10 years in an effort to reduce interest rate risk. These loans are identified as held for sale when originated and sold, on a loan-by-loan basis, in the secondary market. During 2013, the Bancorp sold $13.2 million in newly originated fixed rate mortgage loans, compared to $26.4 million during 2012. Net gains realized from the mortgage loan sales totaled $379 thousand for 2013, compared to $804 thousand for 2012. Also, during the second quarter of 2012, the Bancorp conducted a $3.4 million one-time sale of portfolio fixed rate mortgage loans, which the Bancorp’s management considered an interest rate risk mitigation strategy to reduce loan prepayment risk. The segment of loans that were sold had a higher premium value and was projected to prepay significantly faster than the mortgage portfolio's average repayment speed. The gain realized from the prepayment risk reduction strategy totaled $183 thousand and was recorded during the second quarter of 2012. The proceeds from the loan sale were used to fund loans with longer durations and similar yields to the loans that were included in the sales strategy. At December 31, 2013, the Bancorp had $136 thousand in loans that were classified as held for sale.
The allowance for loan losses (ALL) is a valuation allowance for probable incurred credit losses, increased by the provision for loan losses, and decreased by charge-offs net of recoveries. A loan is charged off against the allowance by management as a loss when deemed uncollectible, although collection efforts continue and future recoveries may occur. The determination of the amounts of the ALL and provisions for loan losses is based on management’s current judgments about the credit quality of the loan portfolio with consideration given to all known relevant internal and external factors that affect loan collectability as of the reporting date. The appropriateness of the current period provision and the overall adequacy of the ALL are determined through a disciplined and consistently applied quarterly process that reviews the Bancorp’s current credit risk within the loan portfolio and identifies the required allowance for loan losses given the current risk estimates.
Non-performing loans include those loans that are 90 days or more past due and those loans that have been placed on non-accrual status. Non-performing loans totaled $4.0 million at December 31, 2013, compared to $11.5 million at December 31, 2012, a decrease of $7.5 million or 65.2%. The ratio of non-performing loans to total loans was 0.90% at December 31, 2013, compared to 2.63% at December 31, 2012. The ratio of non-performing loans to total assets was 0.57% at December 31, 2013, compared to 1.66% at December 31, 2012. The decrease in non-performing loans for 2013 is related to loans moving off of non-accrual status, pay downs and charge-offs. At December 31, 2013, all non-performing loans are also accounted for on a non accrual basis, except for three loans totaling $174 thousand that were classified as accruing and 90 days past due.
Loans, internally classified as substandard, totaled $12.2 million at December 31, 2013, compared to $19.7 million at December 31, 2012 a decrease of $7.5 million or 38.1%. The current level of substandard loans is concentrated in one accruing commercial real estate hotel loan in the amount of $4.8 million which is the largest loan in this group. Substandard loans include non-performing loans and potential problem loans, where information about possible credit issues or other conditions causes management to question the ability of such borrowers to comply with loan covenants or repayment terms. No loans were internally classified as doubtful or loss at December 31, 2013 or December 31, 2012. In addition to identifying and monitoring non-performing and other classified loans, management maintains a list of watch loans. Watch loans represent loans management is closely monitoring due to one or more factors that may cause the loan to become classified as substandard. Watch loans totaled $7.5 million at December 31, 2013, compared to $17.7 million at December 31, 2012 a decrease of $10.2 million or 57.6%. The decrease in watch loans is related to the upgrades and balance reductions of commercial real estate and commercial business loan balances, including the complete payoff of all out-of-market participation loans.
| 10 |
A loan is considered impaired when, based on current information and events, it is probable that a borrower will be unable to pay all amounts due according to the contractual terms of the loan agreement. At December 31, 2013, impaired loans totaled $9.9 million, compared to $19.9 million at December 31, 2012 a decrease of $10.0 million or 50.3%. The December 31, 2013, impaired loan balances consist of ten commercial real estate and commercial business loans totaling $9.0 million that are secured by business assets and real estate, and are personally guaranteed by the owners of the businesses. In addition, seven mortgage loans totaling $887 thousand, which are troubled debt restructurings have also been classified as impaired. The December 31, 2013 ALL contained $1.7 million in specific allowances for collateral deficiencies, compared to $2.0 million at December 31, 2012. Typically, management does not individually classify smaller-balance homogeneous loans, such as residential mortgages or consumer loans, as impaired, unless they are troubled debt restructurings.
At December 31, 2013, the Bancorp classified eleven loans totaling $9.3 million as troubled debt restructurings, which involves modifying the terms of a loan to forego a portion of interest or principal or reducing the interest rate on the loan to a rate materially less than market rates, or materially extending the maturity date of a loan. The Bancorp’s troubled debt restructurings includes one commercial real estate hotel loan in the amount of $4.8 million, for which significant deferrals of principal repayments were granted; one commercial real estate loan in the amount of $2.4 million for which a significant deferral of principal and interest repayment was granted; one commercial real estate loan in the amount of $535 thousand for which a significant deferral of principal and interest repayment was granted by the Bank as required by a bankruptcy plan; one development loan in the amount of $707 thousand for which credit underwriting concessions were granted; and seven mortgage loans totaling $887 thousand, for which maturity dates were materially extended. At December 31, 2013, $8.1 million of the Bancorp’s loans classified as troubled debt restructurings are accruing loans. The valuation basis for the Bancorp’s troubled debt restructurings is based on the present value of cash flows, unless consistent cash flows are not present, then the fair value of the collateral securing the loan is the basis for valuation.
At December 31, 2013, management is of the opinion that there are no loans, except those discussed above, where known information about possible credit problems of borrowers causes management to have serious doubts as to the ability of such borrowers to comply with the present loan repayment terms and which will imminently result in such loans being classified as past due, non-accrual or a troubled debt restructure. Management does not presently anticipate that any of the non-performing loans or classified loans would materially impact future operations, liquidity or capital resources.
For 2013, $450 thousand in provisions to the ALL were required, compared to $2.4 million for 2012 a decrease of $1.9 million or 80.8%. The ALL provision decrease for 2013 is primarily a result of improved asset quality. The current year ALL provisions were primarily related to the current credit risk in the commercial real estate loan portfolio and 2013 loan originations. For 2013, charge-offs, net of recoveries, totaled $1.7 million, compared to $1.9 million for 2012. The net loan charge-offs for 2013 were comprised of $788 thousand in commercial real estate loans, $567 thousand in commercial business loans, $332 thousand in commercial real estate participation loans, $153 thousand in residential real estate loans, and $17 thousand in consumer loans. The ALL provisions take into consideration management’s current judgments about the credit quality of the loan portfolio, loan portfolio balances, changes in the portfolio mix and local economic conditions. In determining the provision for loan losses for the current period, management has given consideration to historically elevated risks associated with the local economy, changes in loan balances and mix, and asset quality.
The ALL to total loans was 1.64% at December 31, 2013, compared to 1.93% at December 31, 2012. The ALL to non-performing loans (coverage ratio) was 181.82% at December 31, 2013, compared to 73.34% at December 31, 2012. The December 31, 2013 balance in the ALL account of $7.2 million is considered adequate by management after evaluation of the loan portfolio, past experience and current economic and market conditions. While management may periodically allocate portions of the allowance for specific problem loans, the whole allowance is available for any loan charge offs that occur. The allocation of the ALL reflects performance and growth trends within the various loan categories, as well as consideration of the facts and circumstances that affect the repayment of individual loans, and loans which have been pooled as of the evaluation date, with particular attention given to non-performing loans and loans which have been classified as substandard, doubtful or loss. Management has allocated reserves to both performing and non-performing loans based on current information available.
At December 31, 2013, foreclosed real estate totaled $1.1 million, which was comprised of nine properties, compared to $425 thousand and ten properties at December 31, 2012. During 2013, loans totaling $1.6 million were transferred into foreclosed real estate, while net sales of foreclosed real estate totaled $369 thousand. Most transfers to foreclosed real estate occurred during the last five months of the year. Net gains from the 2013 sales totaled $17 thousand. At the end of December 2013 all of the Bancorp’s foreclosed real estate is located within its primary market area.
| 11 |
At December 31, 2013, the Bancorp's investment portfolio totaled $194.3 million and was invested as follows: 51.7% in U.S. government agency mortgage-backed securities and collateralized mortgage obligations, 37.9% in municipal securities, 9.4% in U.S. government agency debt securities, and 1.0% in trust preferred securities. During 2013, securities increased by $6.8 million (3.6%). In addition, at December 31, 2013, the Bancorp had $3.1 million in FHLB stock.
As of December 31, 2013, three of the Bancorp’s four investments in trust preferred securities are in “payment in kind” status. Payment in kind status results in a temporary delay in the payment of interest. As a result of a delay in the collection of the interest payments, management placed these securities on non-accrual status. At December 31, 2013, the cost basis of the three trust preferred securities on non-accrual status totaled $3.9 million. Current estimates indicate that the interest payment delays may continue through 2019. One trust preferred security with a cost basis of $1.3 million remains on accrual status.
Deposits are a fundamental and cost-effective source of funds for lending and other investment purposes. The Bancorp offers a variety of products designed to attract and retain customers, with the primary focus on building and expanding relationships. At December 31, 2013, deposits totaled $572.9 million. During 2013, deposits increased by $6.5 million (1.1%). The 2013 change in deposits was comprised of the following: certificates of deposit decreased by $16.1 million (9.3%), checking accounts increased by $3.7 million (2.0%), savings accounts increased by $6.8 million (8.8%), and money market deposit accounts (MMDA’s) increased by $12.1 million (9.7%). During 2013, management continues to allow higher cost certificates of deposit to mature while relying on funding from checking, MMDA, and savings deposits. The increase in checking, savings, and MMDA balances is a result of customer preferences for liquid investments in the current low interest rate environment.
The Bancorp’s borrowed funds are primarily comprised of repurchase agreements and FHLB advances that are used to fund asset growth not supported by deposit generation. At December 31, 2013, borrowed funds totaled $44.9 million compared to $49.5 million at December 31, 2012, a decrease of $4.6 million (9.3%). During 2013, management reduced borrowed funds while relying more on low cost core deposits for funding. Retail repurchase agreements totaled $14.0 million at December 31, 2013, compared to $16.3 million at December 31, 2012, a decrease of $2.3 million (7.0%). FHLB advances totaled $30.9 million, decreasing $2.3 million or 13.9%. The Bancorp’s FHLB line of credit carried a balance of $714 thousand at December 31, 2013 compared to no balance at December 31, 2012. Other short-term borrowings totaled $84 thousand at December 31, 2013, compared to $207 thousand at December 31, 2012.
Liquidity and Capital Resources
The Bancorp’s primary goals for funds and liquidity management are to generate sufficient cash to fund current loan demand, meet deposit withdrawals, and pay dividends and operating expenses. Because profit and liquidity are often conflicting objectives, management attempts to maximize the Bank’s net interest margin by making adequate, but not excessive, liquidity provisions. Furthermore, funds are managed so that future profits will not be significantly impacted as funding costs increase.
Changes in the liquidity position result from operating, investing and financing activities. Cash flows from operating activities are generally the cash effects of transactions and other events that enter into the determination of net income. The primary investing activities include loan originations, loan repayments, investments in interest bearing balances in financial institutions, and the purchase, sale, and maturity of investment securities. Financing activities focus almost entirely on the generation of customer deposits. In addition, the Bancorp utilizes borrowings (i.e., repurchase agreements, FHLB advances and federal funds purchased) as a source of funds.
During 2013, cash and cash equivalents decreased $12.6 million compared to an increase of $7.4 million for 2012. During 2013, the primary sources of cash and cash equivalents were from maturities and sales of securities, deposit originations, loan sales and repayments, an FHLB advance, and cash from operating activities. The primary uses of cash and cash equivalents were loan originations, purchase of securities, expenditures for premises and equipment, FHLB advance repayments, and the payment of common stock dividends. During 2013, cash from operating activities totaled $7.2 million, compared to $8.5 million for 2012. The 2013 decrease in cash provided by operating activities was primarily a result of timing differences of customer ACH deposit activity. Cash outflows from investing activities totaled $19.2 million during 2013, compared to outflows of $36.3 million during 2012. The changes for the current year were related to increased loan originations, the purchase of loan participations, purchases of securities, and increased investment in premises and equipment as detailed in the notes to the financial statements. Net cash outflows from financing activities totaled $600 thousand in 2013, compared to net cash inflows of $35.2 million in 2012. The change during 2013 was primarily due to a decrease in FHLB advances and other borrowed funds as detailed in the notes to the financial statements. The Bancorp paid dividends on common stock on a cash basis of $2.3 million and $1.9 million during 2013 and 2012, respectively. During 2013, the Bancorp’s Board of Directors increased dividends as earnings and capital improved.
Management strongly believes that safety and soundness is enhanced by maintaining a high level of capital. Stockholders' equity totaled $66.8 million at December 31, 2013, compared to $67.7 million at December 31, 2012, a decrease of $0.9 million (1.3%). The decrease was primarily the result of $5.5 million change in other comprehensive income for 2013 related to decreases in the values of available-for-sale securities. Additional items decreasing stockholders' equity was $142 thousand from the sale of treasury stock, and the Bancorp’s declaration of $2.4 million in cash dividends. Increasing stockholders' equity was net income of $7.1 million. At December 31, 2013, book value per share was $23.50 compared to $23.83 for 2012.
| 12 |
The Bancorp is subject to risk-based capital guidelines adopted by the Board of Governors of the Federal Reserve System (the FRB), and the Bank is subject to risk-based capital guidelines adopted by the FDIC. As applied to the Bancorp and the Bank, the FRB and FDIC capital requirements are substantially the same. These regulations divide capital into two tiers. The first tier (Tier 1) includes common equity, certain non-cumulative perpetual preferred stock and minority interests in equity accounts of consolidated subsidiaries, less goodwill and certain other intangible assets. Supplementary (Tier 2) capital includes, among other things, cumulative perpetual and long-term limited-life preferred stock, mandatory convertible securities, certain hybrid capital instruments, term subordinated debt and the allowance for loan losses, subject to certain limitations, less required deductions. The Bancorp and the Bank are required to maintain a total risk-based capital ratio of 8%, of which 4% must be Tier 1 capital. In addition, the FRB and FDIC regulations provide for a minimum Tier 1 leverage ratio (Tier 1 capital to adjusted average assets) of 3% for financial institutions that meet certain specified criteria, including that they have the highest regulatory rating and are not experiencing or anticipating significant growth. All other financial institutions are required to maintain a Tier 1 leverage ratio of 3% plus an additional cushion of at least one to two percent.
The following table shows that, at December 31, 2013, the Bancorp’s capital exceeded all regulatory capital requirements. At December 31, 2013, the Bancorp’s and the Bank’s regulatory capital ratios were substantially the same. The dollar amounts are in millions.
| Minimum | ||||||||||||||||||||||||
| Required To Be | ||||||||||||||||||||||||
| Well Capitalized | ||||||||||||||||||||||||
| Minimum Required | Under Prompt | |||||||||||||||||||||||
| For Capital | Corrective | |||||||||||||||||||||||
| Actual | Adequacy Purposes | Action Regulations | ||||||||||||||||||||||
| At December 31, 2013 | Amount | Ratio | Amount | Ratio | Amount | Ratio | ||||||||||||||||||
| Total capital to risk-weighted assets | $ | 75.0 | 15.6 | % | $ | 38.5 | 8.0 | % | $ | 48.2 | 10.0 | % | ||||||||||||
| Tier 1 capital to risk-weighted assets | $ | 69.0 | 14.3 | % | $ | 19.3 | 4.0 | % | $ | 28.9 | 6.0 | % | ||||||||||||
| Tier 1 capital to adjusted average assets | $ | 69.0 | 10.0 | % | $ | 20.8 | 3.0 | % | $ | 34.6 | 5.0 | % | ||||||||||||
The Bancorp’s ability to pay dividends to its shareholders is entirely dependent upon the Bank’s ability to pay dividends to the Bancorp. Under Indiana law, the Bank may pay dividends from its undivided profits (generally, earnings less losses, bad debts, taxes and other operating expenses) as is considered expedient by the Bank’s Board of Directors. However, the Bank must obtain the approval of the Indiana Department of Financial Institutions (DFI) for the payment of a dividend if the total of all dividends declared by the Bank during the current year, including the proposed dividend, would exceed the sum of retained net income for the year to date plus its retained net income for the previous two years. For this purpose, “retained net income,” means net income as calculated for call report purposes, less all dividends declared for the applicable period. An exemption from DFI approval would require that the Bank have been assigned a composite uniform financial institutions rating of 1 or 2 as a result of the most recent federal or state examination; the proposed dividend would not result in a Tier 1 leverage ratio below 7.5%; and that the Bank not be subject to any corrective action, supervisory order, supervisory agreement, or board approved operating agreement. The aggregate amount of dividends that may be declared by the Bank in 2013, with prior DFI approval is $9.4 million plus 2013 net profits. Moreover, the FDIC and the Federal Reserve Board may prohibit the payment of dividends if it determines that the payment of dividends would constitute an unsafe or unsound practice in light of the financial condition of the Bank. On November 22, 2013, the Board of Directors of the Bancorp declared a fourth quarter dividend of $0.22 per share. The Bancorp’s fourth quarter dividend was paid to shareholders on January 4, 2014.
Results of Operations –
Comparison of 2013 to 2012
Net income for 2013 was $7.1 million, compared to $6.9 million for 2012, an increase of $265 thousand (3.9%). The increase in net income for 2013 was the result of lower required provisions for loan losses, and higher net interest income, and lower noninterest expense. The earnings represent a return on average assets of 1.03% for 2013 compared to 1.02% for 2012. The return on average equity was 10.17% for 2013 compared to 10.27% for 2012.
Net interest income for 2013 was $24.4 million, an increase of $700 thousand (3.0%) from $23.7 million for 2012. During the year, the Bancorp’s cost of funds continued to be positively impacted by the Federal Reserve’s actions in maintaining a low short-term interest rate environment, however, the Bancorp’s yield on interest earning assets is being negatively impacted by lower long-term interest rates. The weighted-average yield on interest-earning assets was 4.03% for 2013 compared to 4.14% for 2012. The weighted-average cost of funds was 0.28% for 2013 compared to 0.39% for 2012. The impact of the 4.03% return on interest earning assets and the 0.28% cost of funds resulted in a net interest spread of 3.75% for 2013, which was unchanged compared to 2012. During 2013, total interest income increased by $82 thousand (0.3%) while total interest expense decreased by $618 thousand (26.3%). The net interest margin was 3.77% for 2013, which was unchanged compared to 2012. The Bancorp’s tax equivalent net interest margin for 2013 was 3.98% compared to 3.96% for 2012.
| 13 |
During 2013, interest income from loans increased by $226 thousand (1.1%) compared to 2012. The increase was primarily due to the receipt of $1.4 million of interest from a previously non-performing loan. The weighted-average yield on loans outstanding was 4.79% for 2013 compared to 4.88% for 2012. Loan balances averaged $436.4 million for 2013, an increase of $12.8 million (3.0%) from $423.6 million for 2012. During 2013, interest income from securities and other interest earning assets decreased by $144 thousand (2.6%) compared to 2012. The decrease was due to a decrease in the weighted average yield. The weighted-average yield on securities and other interest earning assets was 2.48% for 2013 compared to 2.62% for 2012. Securities and other interest earning assets averaged $212.3 million for 2013, up $6.0 million (2.9%) from $206.3 million for 2012.
Interest expense for deposits decreased by $432 thousand (27.4%) during 2013 compared to 2012. The change was due to a decrease in the weighted-average rate paid on deposits. The weighted-average rate paid on deposits for 2013 was 0.20% compared to 0.29% for 2012. Total deposit balances averaged $563.3 million for 2013, an increase of $24.7 million (4.6%) from $538.6 million for 2012. Interest expense for borrowed funds decreased by $186 thousand (24.1%) during 2013 compared to 2012. The change was due to higher average balances. The weighted-average cost of borrowed funds was 1.15% for 2013 compared to 1.32% for 2012. Borrowed funds averaged $51.1 million during 2013, a decrease of $7.6 million (12.9%) from $58.7 million for 2012.
Noninterest income for 2013 was $5.4 million, a decrease of $2.2 million (28.9%) from $7.5 million for 2012. During 2013, fees and service charges totaled $2.5 million, a decrease of $140 thousand (5.2%) from $2.7 million for 2012. The decrease was the result of lower loan and consumer deposit related fees. Fees from Wealth Management operations totaled $1.4 million for 2013, an increase of $133 thousand (10.5%) from $1.3 million for 2012. The increase in Wealth Management income is related to growth in assets under management and market value changes. Gains from the sale of securities totaled $630 thousand for the current year, a decrease of $490 thousand (43.8 %) from $1.1 million for 2012. Current market conditions continue to provide opportunities to manage securities cash flows, while recognizing gains from the sales of securities. Gains from loan sales totaled $379 thousand for the current year, a decrease of $608 thousand (61.6%), compared to $987 thousand for 2012. The decrease in gains from the sale of loans is the result of the sale of seasoned fixed rate mortgages with accelerated rates of prepayment, which resulted in a one-time gain of $183 thousand for the year ended December 31, 2012. During the third quarter of 2012, a senior manager passed away and the Bancorp received a $587 thousand benefit from bank owned life insurance. For 2013, foreclosed real estate sales gains totaled $17 thousand, a decrease of $413 thousand (96.0%) from gains of $430 thousand for 2012. The decrease is partly related to the Bancorp’s favorable settlement in its lawsuit against the lead lender of a commercial real estate participation loan in 2012. In 2013, no income from the increase in the cash value of bank owned life insurance was recorded, compared to $587 thousand for 2012. During 2013, no other-than-temporary impairment was recognized compared to $6 thousand of impairment recognized during 2012. During 2013, other noninterest income totaled $19 thousand, a decrease of $77 thousand (80.2%) from $96 thousand for 2012.
Noninterest expense for 2013 was $19.8 million, down $298 thousand (1.5%) from $20.1 million for 2012. During 2013, compensation and benefits totaled $10.6 million, a decrease of $184 thousand (1.7%) from $10.8 million for 2012. The decrease in compensation and benefits is the result of the Bancorp’s continued efforts to closely monitor and manage staffing levels. Occupancy and equipment expense totaled $3.1 million for 2013, an increase of $56 thousand (1.8%) compared to $3.1 million for 2012. The increase in occupancy and equipment expense is the result of slightly higher building operating expenses during 2013. Data processing expense totaled $1.0 million for 2013, a decrease of $52 thousand (4.8%) from $1.1 million for 2012. The change is a result of lower contract costs. Federal deposit insurance premiums totaled $503 thousand for 2013, a decrease of $68 thousand (11.9%) from $571 thousand for 2012. The decrease was the result of lower FDIC assessment rates. Marketing expense related to banking products totaled $509 thousand for the year, an increase of $129 thousand (33.9%) from $380 thousand for 2012. Statement and check processing expense totaled $310 thousand for the year, a decrease of $7 thousand (2.2%) from $317 thousand for 2012. Professional service expense totaled $288 thousand for the year, an increase of $9 thousand (3.2%) from $279 thousand for 2012. The increase in professional services is primarily related to slightly higher legal expense. Other expenses related to banking operations totaled $3.5 million for 2013, an increase of $181 thousand (5.0%) from $3.7 million for 2012. The Bancorp’s efficiency ratio for 2013 was 66.55% compared to 64.36% for 2012. The higher efficiency ratio is primarily the result of lower total noninterest income. The ratio is determined by dividing total noninterest expense by the sum of net interest income and total noninterest income for the period.
| 14 |
The Bancorp had an income tax expense for 2013 of $2.4 million compared to income tax expense of $1.9 million for 2012, an increase to expense of $456 thousand (23.5%). The combined effective federal and state tax rates for the Bancorp were 25.2% for 2013 and 22.1% for 2012. The current year’s higher effective tax rate is the result of higher taxable income as a percentage of total income, higher earnings, and lower tax preferred income, as well as an adjustment to the Bancorp’s state deferred tax asset for a reduction in tax rates. Details of deferred and current tax items can be found in Note 6 – Income Taxes.
Critical Accounting Policies
Critical accounting policies are those accounting policies that management believes are most important to the portrayal of the Bancorp’s financial condition and that require management’s most difficult, subjective or complex judgments. The Bancorp’s most critical accounting policies are summarized below. Other accounting policies, including those related to the fair values of financial instruments and the status of contingencies, are summarized in Note 1 to the Bancorp’s consolidated financial statements.
Valuation of Investment Securities – The fair values of securities available for sale are determined on a recurring basis by obtaining quoted prices on nationally recognized securities exchanges or pricing models utilizing significant observable inputs such as matrix pricing, which is a mathematical technique widely used in the industry to value debt securities without relying exclusively on quoted prices for the specific securities but rather by relying on the securities’ relationship to other benchmark quoted securities. Different judgments and assumptions used in pricing could result in different estimates of value. In certain cases where market data is not readily available because of lack of market activity or little public disclosure, values may be based on unobservable inputs and classified in Level 3 of the fair value hierarchy.
At the end of each reporting period securities held in the investment portfolio are evaluated on an individual security level for other-than-temporary impairment in accordance with the Investments – Debt and Equity Securities Topic of the Accounting Standards Codification. Significant judgments are required in determining impairment, which include making assumptions regarding the estimated prepayments, loss assumptions and the change in interest rates.
We consider the following factors when determining an other-than-temporary impairment for a security: The length of time and the extent to which the market value has been less than amortized cost; the financial condition and near-term prospects of the issuer; the underlying fundamentals of the relevant market and the outlook for such market for the near future; and an assessment of whether the Bancorp has (1) the intent to sell the debt securities or (2) more likely than not will be required to sell the debt securities before its anticipated market recovery. If either of these conditions is met, management will recognize other-than-temporary impairment. If, in management’s judgment, an other-than-temporary impairment exists, the cost basis of the security will be written down for the credit loss, and the unrealized loss will be transferred from accumulated other comprehensive loss as an immediate reduction of current earnings. Management will utilize an independent valuation specialist to value securities for other-than-temporary impairment.
Allowance for Loan Losses – The Bancorp maintains an Allowance for Loan Losses (ALL) to absorb probable incurred credit losses that arise from the loan portfolio. The ALL is increased by the provision for loan losses, and decreased by charge-offs net of recoveries. The determination of the amounts of the ALL and provisions for loan losses is based upon management’s current judgments about the credit quality of the loan portfolio with consideration given to all known relevant internal and external factors that affect loan collectability. The methodology used to determine the current year provision and the overall adequacy of the ALL includes a disciplined and consistently applied quarterly process that combines a review of the current position with a risk assessment worksheet. Factors that are taken into consideration in the analysis include an assessment of national and local economic trends, a review of current year loan portfolio growth and changes in portfolio mix, and an assessment of trends for loan delinquencies and loan charge-off activity. Particular attention is given to non-accruing loans and accruing loans past due 90 days or more, and loans that have been classified as substandard, doubtful, or loss. Changes in the provision are directionally consistent with changes in observable data.
Commercial and industrial, and commercial real estate loans that exhibit credit weaknesses and loans that have been classified as impaired are subject to an individual review. Where appropriate, ALL allocations are made to these loans based on management’s assessment of financial position, current cash flows, collateral values, financial strength of guarantors, industry trends, and economic conditions. ALL allocations for homogeneous loans, such as residential mortgage loans and consumer loans, are based on historical charge-off activity and current delinquency trends. Management has allocated general reserves to both performing and non-performing loans based on historical data and current information available.
Risk factors for non-performing and internally classified loans are based on an analysis of either the projected discounted cash flows or the estimated collateral liquidation value for individual loans defined as substandard or doubtful. Estimated collateral liquidation values are based on established loan underwriting standards and adjusted for current mitigating factors on a loan-by-loan basis. Aggregate substandard loan collateral deficiencies are determined for residential, commercial real estate, commercial business, and consumer loan portfolios. These deficiencies are then stated as a percentage of the total substandard balances to determine the appropriate risk factors.
| 15 |
Risk factors for performing and non-classified loans are based on a weighted average of net charge-offs for the most recent three years, which are then stated as a percentage of average loans for the same period. Historical risk factors are calculated for residential, commercial real estate, commercial business, and consumer loans. The three year weighted average historical factors are then adjusted for current subjective risks attributable to: regional and national economic factors; loan growth and changes in loan composition; organizational structure; composition of loan staff; loan concentrations; policy changes and out of market lending activity.
The risk factors are applied to these types of loans to determine the appropriate level for the ALL. Adjustments may be made to these allocations that reflect management’s judgment on current conditions, delinquency trends, and charge-off activity. Based on the above discussion, management believes that the ALL is currently adequate, but not excessive, given the risk inherent in the loan portfolio.
Impact of Inflation and Changing Prices The financial statements and related data presented herein have been prepared in accordance with accounting principles generally accepted in the United States of America, which require the measurement of financial position and operating results in terms of historical dollars, without considering changes in the relative purchasing power of money over time due to inflation. The primary assets and liabilities of the Bancorp are monetary in nature. As a result, interest rates have a more significant impact on the Bancorp’s performance than the effects of general levels of inflation. Interest rates do not necessarily move in the same direction or magnitude as the prices of goods and services.
Forward-Looking Statements
Statements contained in this report that are not historical facts are forward-looking statements within the meaning of the Private Securities Litigation Reform Act of 1995. The words or phrases “would be,” “will allow,” “intends to,” “will likely result,” “are expected to,” “will continue,” “is anticipated,” “estimate,” “project,” or similar expressions are also intended to identify “forward-looking statements” within the meaning of the Private Securities Litigation Reform Act. The Bancorp cautions readers that forward-looking statements, including without limitation, those relating to the Bancorp’s future business prospects, interest income and expense, net income, liquidity, and capital needs are subject to certain risks and uncertainties that could cause actual results to differ materially from those indicated in the forward-looking statements, due to, among other things, factors identified in this report.
| 16 |
Report of Independent
Registered
Public Accounting Firm
Board of Directors
NorthWest Indiana Bancorp and Subsidiary
Munster, Indiana
We have audited the accompanying consolidated balance sheets of NorthWest Indiana Bancorp and Subsidiary (the “Company”) as of December 31, 2013 and 2012, and the related consolidated statements of income, comprehensive income, changes in stockholders' equity, and cash flows for the years then ended. The consolidated financial statements are the responsibility of the Company’s management. Our responsibility is to express an opinion on the consolidated financial statements based on our audits.
We conducted our audits in accordance with the standards of the Public Company Accounting Oversight Board (United States). Those standards require that we plan and perform the audits to obtain reasonable assurance about whether the consolidated financial statements are free of material misstatement. The Company is not required to have, nor were we engaged to perform, an audit of its internal control over financial reporting. Our audits included consideration of internal control over financial reporting as a basis for designing audit procedures that are appropriate in the circumstances, but not for the purpose of expressing an opinion on the effectiveness of the Company’s internal control over financial reporting. Accordingly we express no such opinion. An audit includes examining, on a test basis, evidence supporting the amounts and disclosures in the consolidated financial statements. An audit also includes assessing the accounting principles used and significant estimates made by management, as well as evaluating the overall consolidated financial statement presentation. We believe that our audits provide a reasonable basis for our opinion.
In our opinion, the consolidated financial statements referred to above present fairly, in all material respects, the consolidated financial position of NorthWest Indiana Bancorp and Subsidiary as of December 31, 2013 and 2012, and the consolidated results of their operations and cash flows for the years then ended in conformity with accounting principles generally accepted in the United States of America.
 | |
| Plante & Moran, PLLC |
Chicago, Illinois
February 25, 2014
| 17 |
Consolidated Balance Sheets
| December 31, | ||||||||
| (Dollars in thousands) | 2013 | 2012 | ||||||
| ASSETS | ||||||||
| Cash and non-interest bearing deposits in other financial institutions | $ | 11,758 | $ | 8,512 | ||||
| Interest bearing deposits in other financial institutions | 9,256 | 24,827 | ||||||
| Federal funds sold | 110 | 412 | ||||||
| Total cash and cash equivalents | 21,124 | 33,751 | ||||||
| Securities available-for-sale | 194,296 | 187,475 | ||||||
| Loans held-for-sale | 136 | 323 | ||||||
| Loans receivable | 437,821 | 436,981 | ||||||
| Less: allowance for loan losses | (7,189 | ) | (8,421 | ) | ||||
| Net loans receivable | 430,632 | 428,560 | ||||||
| Federal Home Loan Bank stock | 3,086 | 3,086 | ||||||
| Accrued interest receivable | 2,480 | 2,483 | ||||||
| Premises and equipment | 17,260 | 17,678 | ||||||
| Foreclosed real estate | 1,084 | 425 | ||||||
| Cash value of bank owned life insurance | 16,396 | 12,516 | ||||||
| Prepaid FDIC insurance premium | - | 991 | ||||||
| Other assets | 6,959 | 4,557 | ||||||
| Total assets | $ | 693,453 | $ | 691,845 | ||||
| LIABILITIES AND STOCKHOLDERS' EQUITY | ||||||||
| Deposits: | ||||||||
| Non-interest bearing | $ | 73,430 | $ | 75,228 | ||||
| Interest bearing | 499,463 | 491,181 | ||||||
| Total | 572,893 | 566,409 | ||||||
| Repurchase agreements | 14,031 | 16,298 | ||||||
| Borrowed funds | 30,898 | 33,207 | ||||||
| Accrued expenses and other liabilities | 8,870 | 8,280 | ||||||
| Total liabilities | 626,692 | 624,194 | ||||||
| Stockholders' Equity: | ||||||||
| Preferred stock, no par or stated value; 10,000,000 shares authorized, none outstanding | - | - | ||||||
| Common stock, no par or stated value; 10,000,000 shares authorized; | ||||||||
| shares issued: December 31, 2013 - 2,897,202 | ||||||||
| December 31, 2012 - 2,888,902 | ||||||||
| shares outstanding: December 31, 2013 - 2,841,164 | ||||||||
| December 31, 2012 - 2,839,137 | 361 | 361 | ||||||
| Additional paid-in capital | 5,229 | 5,189 | ||||||
| Accumulated other comprehensive income | (3,151 | ) | 2,339 | |||||
| Retained earnings | 65,519 | 60,817 | ||||||
| Treasury stock, common shares at cost: December 31, 2013 - 56,038 | ||||||||
| December 31, 2012 - 49,765 | (1,197 | ) | (1,055 | ) | ||||
| Total stockholders' equity | 66,761 | 67,651 | ||||||
| Total liabilities and stockholders' equity | $ | 693,453 | $ | 691,845 | ||||
See accompanying notes to consolidated financial statements.
| 18 |
Consolidated Statements of Income
| (Dollars in thousands, except per share data) | Year Ended December 31, | |||||||
| 2013 | 2012 | |||||||
| Interest income: | ||||||||
| Loans receivable | ||||||||
| Real estate loans | $ | 17,772 | $ | 17,168 | ||||
| Commercial loans | 3,101 | 3,466 | ||||||
| Consumer loans | 18 | 31 | ||||||
| Total loan interest | 20,891 | 20,665 | ||||||
| Securities | 5,225 | 5,387 | ||||||
| Other interest earning assets | 41 | 23 | ||||||
| Total interest income | 26,157 | 26,075 | ||||||
| Interest expense: | ||||||||
| Deposits | 1,143 | 1,575 | ||||||
| Repurchase agreements | 69 | 79 | ||||||
| Borrowed funds | 518 | 694 | ||||||
| Total interest expense | 1,730 | 2,348 | ||||||
| Net interest income | 24,427 | 23,727 | ||||||
| Provision for loan losses | 450 | 2,350 | ||||||
| Net interest income after provision for loan losses | 23,977 | 21,377 | ||||||
| Noninterest income: | ||||||||
| Fees and service charges | 2,537 | 2,677 | ||||||
| Wealth management operations | 1,397 | 1,264 | ||||||
| Gain on sale of securities, net | 630 | 1,120 | ||||||
| Increase in cash value of bank owned life insurance | 380 | 381 | ||||||
| Gain on sale of loans held-for-sale, net | 379 | 987 | ||||||
| Gain on sale of foreclosed real estate | 17 | 430 | ||||||
| Benefit from bank owned life insurance | - | 587 | ||||||
| Other-than-temporary credit impairment of debt securities | - | (6 | ) | |||||
| Noncredit portion of other-than-temporary credit impairment of debt securities recognized in other comprehensive income | - | - | ||||||
| Other | 19 | 96 | ||||||
| Total noninterest income | 5,359 | 7,536 | ||||||
| Noninterest expense: | ||||||||
| Compensation and benefits | 10,599 | 10,783 | ||||||
| Occupancy and equipment | 3,120 | 3,064 | ||||||
| Data processing | 1,021 | 1,073 | ||||||
| Marketing | 509 | 380 | ||||||
| Federal deposit insurance premiums | 503 | 571 | ||||||
| Statement and check processing | 310 | 317 | ||||||
| Professional services | 288 | 279 | ||||||
| Other | 3,471 | 3,652 | ||||||
| Total noninterest expense | 19,821 | 20,119 | ||||||
| Income before income tax expenses | 9,515 | 8,794 | ||||||
| Income tax expenses | 2,397 | 1,941 | ||||||
| Net income | $ | 7,118 | $ | 6,853 | ||||
| Earnings per common share: | ||||||||
| Basic | $ | 2.50 | $ | 2.41 | ||||
| Diluted | $ | 2.50 | $ | 2.41 | ||||
| Dividends declared per common share | $ | 0.85 | $ | 0.72 | ||||
See accompanying notes to consolidated financial statements.
| 19 |
Consolidated Statements of
Comprehensive Income
| (Dollars in thousands) | Year Ended December 31, | |||||||
| 2013 | 2012 | |||||||
| Net income | $ | 7,118 | $ | 6,853 | ||||
| Net change in net unrealized gains and losses on securities available-for-sale: | ||||||||
| Unrealized (losses)/gains arising during the period | (7,729 | ) | 813 | |||||
| Less: reclassification adjustment for gains included in net income | (630 | ) | (1,114 | ) | ||||
| Net securities loss during the period | (8,359 | ) | (301 | ) | ||||
| Tax effect | 2,866 | 109 | ||||||
| Net of tax amount | (5,493 | ) | (192 | ) | ||||
| Net change in unrecognized gain on postretirement benefit: | ||||||||
| Net gain on post retirement benefit | 8 | 1 | ||||||
| Amortization of net actuarial gain | (5 | ) | (6 | ) | ||||
| Net gain/(loss) during the period | 3 | (5 | ) | |||||
| Tax effect | - | - | ||||||
| Net of tax amount | 3 | (5 | ) | |||||
| Other comprehensive loss, net of tax | (5,490 | ) | (197 | ) | ||||
| Comprehensive income, net of tax | $ | 1,628 | $ | 6,656 | ||||
See accompanying notes to consolidated financial statements.
Consolidated Statements of
Changes in Stockholders’ Equity
| Accumulated | ||||||||||||||||||||||||
| Additional | Other | |||||||||||||||||||||||
| Common | Paid-in | Comprehensive | Retained | Treasury | Total | |||||||||||||||||||
| (Dollars in thousands, except per share data) | Stock | Capital | Income (Loss) | Earnings | Stock | Equity | ||||||||||||||||||
| Balance at January 1, 2012 | $ | 361 | $ | 5,173 | $ | 2,536 | $ | 56,032 | $ | (1,142 | ) | $ | 62,960 | |||||||||||
| Comprehensive income: | ||||||||||||||||||||||||
| Net income | - | - | - | 6,853 | - | 6,853 | ||||||||||||||||||
| Net unrealized loss on securities available-for- sale, net of reclassification and tax effects | - | - | (192 | ) | - | - | (192 | ) | ||||||||||||||||
| Change in unrealized gain on post retirement benefit, net of reclassification and tax effects | - | - | (5 | ) | - | - | (5 | ) | ||||||||||||||||
| Comprehensive income | 6,656 | |||||||||||||||||||||||
| Stock-based compensation expense | - | 16 | - | - | - | 16 | ||||||||||||||||||
| Purchase of treasury stock | - | - | - | - | (78 | ) | (78 | ) | ||||||||||||||||
| Sale of treasury stock | - | - | - | (24 | ) | 165 | 141 | |||||||||||||||||
| Cash dividends, $0.72 per share | - | - | - | (2,044 | ) | - | (2,044 | ) | ||||||||||||||||
| Balance at December 31, 2012 | $ | 361 | $ | 5,189 | $ | 2,339 | $ | 60,817 | $ | (1,055 | ) | $ | 67,651 | |||||||||||
| Comprehensive income: | ||||||||||||||||||||||||
| Net income | - | - | - | 7,118 | - | 7,118 | ||||||||||||||||||
| Net unrealized loss on securities available-for- sale, net of reclassification and tax effects | - | - | (5,493 | ) | - | - | (5,493 | ) | ||||||||||||||||
| Change in unrealized gain on post retirement benefit, net of reclassification and tax effects | - | - | 3 | - | - | 3 | ||||||||||||||||||
| Comprehensive income | 1,628 | |||||||||||||||||||||||
| Stock-based compensation expense | - | 40 | - | - | - | 40 | ||||||||||||||||||
| Purchase of treasury stock | - | - | - | - | (173 | ) | (173 | ) | ||||||||||||||||
| Sale of treasury stock | - | - | - | (1 | ) | 31 | 30 | |||||||||||||||||
| Cash dividends, $0.85 per share | - | - | - | (2,415 | ) | - | (2,415 | ) | ||||||||||||||||
| Balance at December 31, 2013 | $ | 361 | $ | 5,229 | $ | (3,151 | ) | $ | 65,519 | $ | (1,197 | ) | $ | 66,761 | ||||||||||
See accompanying notes to consolidated financial statements.
| 20 |
Consolidated Statements of Cash Flows
| (Dollars in thousands) | Year ended December 31, | |||||||
| 2013 | 2012 | |||||||
| CASH FLOWS FROM OPERATING ACTIVITIES: | ||||||||
| Net income | $ | 7,118 | $ | 6,853 | ||||
| Adjustments to reconcile net income to net cash provided by operating activities: | ||||||||
| Origination of loans for sale | (12,675 | ) | (26,049 | ) | ||||
| Sale of loans originated for sale | 13,159 | 26,405 | ||||||
| Depreciation and amortization, net of accretion | 1,986 | 2,293 | ||||||
| Deferred tax expense | 509 | 152 | ||||||
| Amortization of mortgage servicing rights | 144 | 117 | ||||||
| Stock based compensation expense | 40 | 16 | ||||||
| Gain on sale of securities, net | (630 | ) | (1,120 | ) | ||||
| Gain on sale of loans held-for-sale, net | (379 | ) | (987 | ) | ||||
| Net losses due to other-than-temporary impairment of securities | - | 6 | ||||||
| Gain on sale of foreclosed real estate | (17 | ) | (430 | ) | ||||
| Benefit from bank owned life insurance | - | (587 | ) | |||||
| Provision for loan losses | 450 | 2,350 | ||||||
| Net change in: | ||||||||
| Interest receivable | 3 | 71 | ||||||
| Other assets | 760 | 1,559 | ||||||
| Cash value of bank owned life insurance | (380 | ) | (381 | ) | ||||
| Purchase of bank owned life insurance | (3,500 | ) | - | |||||
| Accrued expenses and other liabilities | 590 | (1,740 | ) | |||||
| Total adjustments | 60 | 1,675 | ||||||
| Net cash - operating activities | 7,178 | 8,528 | ||||||
| CASH FLOWS FROM INVESTING ACTIVITIES: | ||||||||
| Proceeds from maturities and pay downs of securities available-for-sale | 35,026 | 53,862 | ||||||
| Proceeds from sales of securities available-for-sale | 30,144 | 25,900 | ||||||
| Purchase of securities available-for-sale | (80,355 | ) | (80,375 | ) | ||||
| Proceeds from sale of loans transferred to loans held-for-sale | - | 3,591 | ||||||
| Loan participations purchased | (857 | ) | (14,475 | ) | ||||
| Net change in loans receivable | (2,676 | ) | (27,839 | ) | ||||
| Purchase of premises and equipment, net | (893 | ) | (797 | ) | ||||
| Proceeds from sale of foreclosed real estate, net | 369 | 3,834 | ||||||
| Net cash - investing activities | (19,242 | ) | (36,299 | ) | ||||
| CASH FLOWS FROM FINANCING ACTIVITIES: | ||||||||
| Change in deposits | 6,484 | 39,528 | ||||||
| Proceeds from FHLB advances | 11,100 | 2,000 | ||||||
| Repayment of FHLB advances | (14,000 | ) | (5,000 | ) | ||||
| Change in other borrowed funds | (1,676 | ) | 492 | |||||
| Proceeds from sale of treasury stock | 30 | 141 | ||||||
| Treasury stock purchased | (173 | ) | (78 | ) | ||||
| Dividends paid | (2,328 | ) | (1,928 | ) | ||||
| Net cash - financing activities | (563 | ) | 35,155 | |||||
| Net change in cash and cash equivalents | (12,627 | ) | 7,384 | |||||
| Cash and cash equivalents at beginning of period | 33,751 | 26,367 | ||||||
| Cash and cash equivalents at end of period | $ | 21,124 | $ | 33,751 | ||||
| SUPPLEMENTAL CASH FLOW INFORMATION: | ||||||||
| Cash paid during the period for: | ||||||||
| Interest | $ | 1,735 | $ | 2,363 | ||||
| Income taxes | $ | 2,070 | $ | 2,123 | ||||
| SUPPLEMENTAL NONCASH INFORMATION: | ||||||||
| Transfers from loans to foreclosed real estate | $ | 1,566 | $ | 1,626 | ||||
| Transfers from loans to loans held-for-sale | $ | - | $ | 3,428 | ||||
See accompanying notes to consolidated financial statements.
| 21 |
Notes to Consolidated Financial Statements
Years ended December 31, 2013 and 2012
NOTE 1 - Summary of Significant Accounting Policies
Principles of Consolidation – The consolidated financial statements include NorthWest Indiana Bancorp (the “Bancorp”), its wholly owned subsidiary, Peoples Bank SB (the “Bank”), and the Bank’s wholly owned subsidiaries, Peoples Service Corporation, NWIN, LLC, and NWIN Funding, Incorporated, and Columbia Development Company, LLC. The Bancorp has no other business activity other than being a holding company for the Bank. The Bancorp’s earnings are dependent upon the earnings of the Bank. Peoples Service Corporation provides insurance and annuity investments to the Bank’s wealth management customers. NWIN, LLC is located in Las Vegas, Nevada and serves as the Bank’s investment subsidiary and parent of a real estate investment trust, NWIN Funding, Inc. NWIN Funding, Inc. was formed as an Indiana Real Estate Investment Trust. The formation of NWIN Funding, Inc. provides the Bancorp with a vehicle that may be used to raise capital utilizing portfolio mortgages as collateral, without diluting stock ownership. In addition, NWIN Funding, Inc. will receive favorable state tax treatment for income generated by its operations. Columbia Development Company is a limited liability company that serves to hold certain real estate properties that are acquired through foreclosure. All significant inter-company accounts and transactions have been eliminated in consolidation.
Use of Estimates – Preparing financial statements in conformity with accounting principles generally accepted in the United States of America requires management to make estimates and assumptions that affect the reported amounts of assets, liabilities and disclosure of contingent assets and liabilities at the date of the financial statements and the reported amounts of revenue and expenses during the reporting period, as well as the disclosures provided. Actual results could differ from those estimates. Estimates associated with the allowance for loan losses, mortgage servicing rights, fair values of foreclosed real estate, financial instruments and investment securities, and the status of contingencies are particularly susceptible to material change in the near term.
Concentrations of Credit Risk – The Bancorp grants residential, commercial real estate, commercial business and installment loans to customers primarily in Lake County, in northwest Indiana. The Bancorp is also an active lender in Porter County, and to a lesser extent, LaPorte, Newton, and Jasper counties in Indiana, and Lake, Cook and Will counties in Illinois. Substantially all loans are secured by specific items of collateral including residences, commercial real estate, business assets, and consumer assets.
Cash Flow Reporting – For purposes of the statements of cash flows, the Bancorp considers cash on hand, noninterest bearing deposits in other financial institutions, all interest-bearing deposits in other financial institutions with original maturities of 90 days or less, and federal funds sold to be cash and cash equivalents. The Bancorp reports net cash flows for customer loan and deposit transactions and short-term borrowings with maturities of 90 days or less.
Securities – The Bancorp classifies securities into held-to-maturity, available-for-sale, or trading categories. Held-to-maturity securities are those which management has the positive intent and the Bancorp has the ability to hold to maturity, and are reported at amortized cost. Available-for-sale securities are those the Bancorp may decide to sell if needed for liquidity, asset-liability management or other reasons. Available-for-sale securities are reported at fair value, with unrealized gains and losses reported in other comprehensive income, net of tax. The Bancorp does not have a trading portfolio. Realized gains and losses resulting from the sale of securities recorded on the trade date are computed by the specific identification method. Interest and dividend income, adjusted by amortization of premiums or discounts on a level yield method, are included in earnings. Securities are reviewed for other-than-temporary impairment on a quarterly basis.
The Bancorp considers the following factors when determining an other-than-temporary impairment for a security: the length of time and the extent to which the market value has been less than amortized cost; the financial condition and near-term prospects of the issuer; the underlying fundamentals of the relevant market and the outlook for such market for the near future; and an assessment of whether the Bancorp has (1) the intent to sell the debt security or (2) it is more likely than not that the Bancorp will be required to sell the debt security before its anticipated market recovery. If either of these conditions are met, management will recognize other-than-temporary impairment. If, in management’s judgment, an other-than-temporary impairment exists, the cost basis of the security will be written down for the credit loss, and the unrealized credit loss will be transferred from accumulated other comprehensive loss as an immediate reduction of current earnings.
Loans Held-for-Sale – Mortgage loans originated and intended for sale in the secondary market are carried at the lower of aggregate cost or fair market value, as determined by outstanding commitments from investors. Net unrealized losses, if any, are recorded as a valuation allowance and charged to earnings.
Mortgage loans held-for-sale can be sold with servicing rights retained or released. The carrying value of mortgage loans sold is reduced by the amount allocated to the servicing rights. Gains and losses on sales of mortgage loans are based on the difference between the selling price and the carrying value of the related loan sold.
Loans and Loan Income – Loans that management has the intent and ability to hold for the foreseeable future or until maturity or payoff are reported at the principal balance outstanding, net of unearned interest, net deferred loan fees and costs, and an allowance for loan losses. Interest income is accrued on the unpaid principal balance. Loan origination fees, net of certain direct origination costs, are deferred and recognized in interest income using the level-yield method without anticipating prepayments.
The accrual of interest income on mortgage and commercial loans is discontinued at the time the loan is 90 days delinquent unless the loan is well-secured and in process of collection. Consumer loans are typically charged-off no later than when they reach 120 days past due. Past due status is based on the contractual terms of the loan. In all cases, loans are placed on non-accrual or charged-off status at an earlier date if collection of principal or interest is considered doubtful.
| 22 |
Generally, interest accrued but not received for loans placed on non-accrual status is reversed against interest income. Interest received on such loans is accounted for on the cash-basis or cost-recovery method, until qualifying for return to accrual. Loans are returned to accrual status when all the principal and interest amounts contractually due are brought current and future payments are reasonably assured.
Allowance for Loan Losses – The allowance for loan losses (allowance) is a valuation allowance for probable incurred credit losses. Loan losses are charged against the allowance when management believes the uncollectibility of a loan balance is confirmed. Subsequent recoveries, if any, are credited to the allowance. Management estimates the allowance balance required using past loan loss experience, the nature and volume of the portfolio, information about specific borrower situations and estimated collateral values, economic conditions, and other factors. Allocations of the allowance may be made for specific loans, but the entire allowance is available for any loan that, in management’s judgment, should be charged-off.
A loan is considered impaired when, based on current information and events, it is probable that the Bancorp will be unable to collect the scheduled payments of principal or interest when due according to the contractual terms of the loan agreement. Factors considered by management in determining impairment include payment status, collateral value, and the probability of collecting scheduled principal and interest payments when due. Loans that experience insignificant payment delays and payment shortfalls generally are not classified as impaired. Management determines the significance of payment delays and payment shortfalls on a case by case basis, taking into consideration all of the circumstances surrounding the loan and the borrower, including the length of the delay, the reasons for the delay, the borrower’s prior payment record, and the amount of the shortfall in relation to the principal and interest owed. Impairment is measured on a loan by loan basis for commercial and construction loans by either the present value of expected future cash flows discounted at the loan’s effective interest rate, the loan’s obtainable market price, or the fair value of the collateral if the loan is collateral dependent. Large groups of smaller balance homogeneous loans are collectively evaluated for impairment. Accordingly, the Bancorp does not separately identify individual consumer and residential loans for impairment disclosures.
Federal Home Loan Bank Stock – The Bank is a member of the FHLB system. Members are required to own a certain amount of stock based on the level of borrowings and other factors, and may invest in additional amounts. FHLB stock is carried at cost, classified as a restricted security, and periodically evaluated for impairment based on ultimate recovery of par value. Both cash and stock dividends are reported as income.
Transfers of Financial Assets – Transfers of financial assets are accounted for as sales when control over the assets has been surrendered. Control over transferred assets is deemed to be surrendered when (1) the assets have been isolated from the Bancorp, (2) the transferee obtains the right (free of conditions that constrain it from taking advantage of the right) to pledge or exchange the transferred assets, and (3) the Bancorp does not maintain effective control over the transferred assets through an agreement to repurchase them before their maturity.
Premises and Equipment – Land is carried at cost. Premises and equipment are carried at cost less accumulated depreciation. Premises and related components are depreciated using the straight-line method with useful lives ranging from 26 to 39 years. Furniture and equipment are depreciated using the straight-line method with useful lives ranging from 2 to 10 years.
Foreclosed Real Estate – Assets acquired through or instead of loan foreclosure are initially recorded at fair value less estimated costs to sell when acquired, establishing a new cost basis. If fair value declines subsequent to foreclosure, a valuation allowance is recorded through expense. Operating costs after acquisition are expensed.
Long-term Assets – Premises and equipment and other long-term assets are reviewed for impairment when events indicate their carrying amount may not be recoverable from future undiscounted cash flows. If impaired, the assets are recorded at fair value.
Bank Owned Life Insurance – The Bancorp has purchased life insurance policies on certain key executives. In accordance with accounting for split-dollar life insurance, Bank owned life insurance is recorded at the amount that can be realized under the insurance contract at the balance sheet date, which is the cash surrender value adjusted for other charges or other amounts due that are probable at settlement.
Repurchase Agreements – Substantially, all repurchase agreement liabilities represent amounts advanced by various customers that are not covered by federal deposit insurance and are secured by securities owned by the Bancorp.
Postretirement Benefits Other Than Pensions – The Bancorp sponsors a defined benefit postretirement plan that provides comprehensive major medical benefits to all eligible retirees. Postretirement benefits are accrued based on the expected cost of providing postretirement benefits to employees during the years the employees have rendered service to the Bancorp.
Income Taxes – Income tax expense is the total of the current year income tax due or refundable and the change in deferred tax assets and liabilities. Deferred tax assets and liabilities are the expected future tax amounts for the temporary differences between carrying amounts and tax bases of assets and liabilities, computed using enacted tax rates. A valuation allowance, if needed, reduces deferred tax assets to the amount expected to be realized.
Loan Commitments and Related Financial Instruments – Financial instruments include off-balance sheet credit instruments, such as commitments to make loans and standby letters of credit, issued to meet customer financing needs. The face amount for these items represents the exposure to loss, before considering customer collateral or ability to repay. Such financial instruments are recorded when they are funded.
Earnings Per Common Share – Basic earnings per common share is net income divided by the weighted-average number of common shares outstanding during the period. Diluted earnings per common share includes the dilutive effect of additional potential common shares issuable under stock options.
Comprehensive Income – Comprehensive income consists of net income and other comprehensive income. Other comprehensive income includes unrealized gains and losses on securities available-for-sale and the unrecognized gains and losses on postretirement benefits.
| 23 |
Loss Contingencies – Loss contingencies, including claims and legal actions arising in the ordinary course of business, are recorded as liabilities when the likelihood of loss is probable and an amount or range of loss can be reasonably estimated. Management does not believe such matters currently exist that will have a material effect on the financial statements.
Restrictions on Cash – Cash on hand or on deposit with the Federal Reserve Bank of $656,000 and $572,000 was required to meet regulatory reserve and clearing requirements at December 31, 2013 and 2012, respectively. These balances do not earn interest.
Fair Value of Financial Instruments – Fair values of financial instruments are estimated using relevant market information and other assumptions, as more fully disclosed in a separate note. Fair value estimates involve uncertainties and matters of significant judgment regarding interest rates, credit risk, prepayments and other factors, especially in the absence of broad markets for particular instruments. Changes in assumptions or in market conditions could significantly affect the estimates.
Operating Segments – While the Bancorp's executive management monitors the revenue streams of the various products and services, the identifiable segments are not material and operations are managed and financial performance is evaluated on a company-wide basis. Accordingly, all of the Bancorp's financial service operations are considered by management to be aggregated in one reportable operating segment.
Reclassification – Certain amounts appearing in the consolidated financial statements and notes thereto for the year ended December 31, 2012, may have been reclassified to conform to the December 31, 2013 presentation.
Acquisition Activity – On December 20, 2013, the Bank signed a definitive agreement to acquire First Federal Savings and Loan Association of Hammond (the “Association”), a federal mutual savings association headquartered in Hammond, Indiana. The Bank will acquire the Association by merging the Association with and into the Bank immediately following the Association’s voluntary supervisory conversion from mutual to stock form. Neither the Bancorp nor the Bank will issue or pay any shares, cash, or other consideration in the merger. The Bank’s acquisition of the Association is subject to customary closing conditions, including regulatory approvals by the OCC, FDIC, and DFI. No approval of the members of the Association is required for the transaction. The Bank and the Association make certain customary representations and warranties in the definitive acquisition agreement, which will terminate at the closing. The Association has a home office and branch office in Lake County, Indiana, and is expected to add approximately $40.7 million in assets to the Bank, based on the Association’s September 30, 2013 financial statements. The merger is expected to close in the second quarter of 2014.
Adoption of New Accounting Pronouncements
Update Number 2013-02 – Comprehensive Income (Topic 220): Reporting of Amounts Reclassified Out of Accumulated Other Comprehensive Income. The amendments in this Update supersede and replace the presentation requirements for reclassifications out of accumulated other comprehensive income in ASUs 2011-05 (issued in June 2011) and 2011-12 (issued in December 2011) for all public and private organizations. The amendments require an entity to provide additional information about reclassifications out of accumulated other comprehensive income. For public entities, the amendments are effective prospectively for reporting periods beginning after December 15, 2012. The amendments did not change the Bancorp’s presentation of the Consolidated Statements of Comprehensive Income.
NOTE 2 – Securities
The fair value of available-for-sale securities and the related gross unrealized gains and losses recognized in accumulated other comprehensive income (loss) were as follows:
| (Dollars in thousands) | ||||||||||||||||
| Gross | Gross | Estimated | ||||||||||||||
| Cost | Unrealized | Unrealized | Fair | |||||||||||||
| Basis | Gains | Losses | Value | |||||||||||||
| December 31, 2013 | ||||||||||||||||
| U.S. government sponsored entities | $ | 18,997 | $ | - | $ | (637 | ) | $ | 18,360 | |||||||
| Collateralized mortgage obligations and residential mortgage-backed securities | 101,056 | 1,181 | (1,922 | ) | 100,315 | |||||||||||
| Municipal securities | 73,864 | 1,499 | (1,710 | ) | 73,653 | |||||||||||
| Collateralized debt obligations | 5,208 | - | (3,240 | ) | 1,968 | |||||||||||
| Total securities available-for-sale | $ | 199,125 | $ | 2,680 | $ | (7,509 | ) | $ | 194,296 | |||||||
| December 31, 2012 | ||||||||||||||||
| U.S. government sponsored entities | $ | 23,009 | $ | 94 | $ | (7 | ) | $ | 23,096 | |||||||
| Collateralized mortgage obligations and residential mortgage-backed securities | 96,782 | 3,147 | (15 | ) | 99,914 | |||||||||||
| Municipal securities | 58,946 | 4,155 | (28 | ) | 63,073 | |||||||||||
| Collateralized debt obligations | 5,208 | - | (3,816 | ) | 1,392 | |||||||||||
| Total securities available-for-sale | $ | 183,945 | $ | 7,396 | $ | (3,866 | ) | $ | 187,475 | |||||||
The fair value of available-for-sale debt securities and carrying amount, if different, at year end 2013 by contractual maturity were as follows. Securities not due at a single maturity date, primarily mortgage-backed securities, are shown separately.
| (Dollars in thousands) | ||||||||
| Available-for-sale | ||||||||
| Estimated | Tax- | |||||||
| Fair | Equivalent | |||||||
| December 31, 2013 | Value | Yield (%) | ||||||
| Due in one year or less | $ | 1,887 | 7.06 | |||||
| Due from one to five years | 18,343 | 3.16 | ||||||
| Due from five to ten years | 26,822 | 4.55 | ||||||
| Due over ten years | 46,929 | 4.70 | ||||||
| Collateralized mortgage obligations and residential mortgage-backed securities | 100,315 | 2.76 | ||||||
| Total | $ | 194,296 | 3.56 | |||||
Sales of available-for-sale securities were as follows:
| (Dollars in thousands) | ||||||||
| December 31, | December 31, | |||||||
| 2013 | 2012 | |||||||
| Proceeds | $ | 30,144 | 25,900 | |||||
| Gross gains | 733 | 1,120 | ||||||
| Gross losses | (103 | ) | - | |||||
The tax provisions related to these net realized gains were approximately $225,000 for 2013 and $440,000 for 2012.
Accumulated other comprehensive income/(loss) balances, net of tax, related to available-for-sale securities, were as follows:
| (Dollars in thousands) | ||||
| Unrealized | ||||
| gain/(loss) | ||||
| Ending balance, December 31, 2012 | $ | 2,284 | ||
| Current period change | (5,493 | ) | ||
| Ending balance, December 31, 2013 | $ | (3,209 | ) | |
| 24 |
Securities with carrying values of approximately $31,231,000 and $32,935,000 were pledged as of December 31, 2013 and 2012, respectively, as collateral for repurchase agreements, public funds, and for other purposes as permitted or required by law. The reduction in pledged securities is a result of the lifting of a state requirement to pledge securities for public funds on deposit.
Securities with unrealized losses at December 31, 2013 and 2012 not recognized in income are as follows:
| (Dollars in thousands) | ||||||||||||||||||||||||
| Less than 12 months | 12 months or longer | Total | ||||||||||||||||||||||
| Estimated | Estimated | Estimated | ||||||||||||||||||||||
| Fair | Unrealized | Fair | Unrealized | Fair | Unrealized | |||||||||||||||||||
| Value | Losses | Value | Losses | Value | Losses | |||||||||||||||||||
| December 31, 2013 | ||||||||||||||||||||||||
| U.S. government sponsored entities | $ | 18,360 | $ | (637 | ) | $ | - | $ | - | $ | 18,360 | $ | (637 | ) | ||||||||||
| Collateralized mortgage obligations and residential mortgage-backed securities | 62,748 | (1,922 | ) | - | - | 62,748 | (1,922 | ) | ||||||||||||||||
| Municipal securities | 27,890 | (1,571 | ) | 1,478 | (139 | ) | 29,368 | (1,710 | ) | |||||||||||||||
| Collateralized debt obligations | - | - | 1,968 | (3,240 | ) | 1,968 | (3,240 | ) | ||||||||||||||||
| Total temporarily impaired | $ | 108,998 | $ | (4,130 | ) | $ | 3,446 | $ | (3,379 | ) | $ | 112,444 | $ | (7,509 | ) | |||||||||
| Number of securities | 117 | 8 | 125 | |||||||||||||||||||||
| (Dollars in thousands) | ||||||||||||||||||||||||
| Less than 12 months | 12 months or longer | Total | ||||||||||||||||||||||
| Estimated | Estimated | Estimated | ||||||||||||||||||||||
| Fair | Unrealized | Fair | Unrealized | Fair | Unrealized | |||||||||||||||||||
| Value | Losses | Value | Losses | Value | Losses | |||||||||||||||||||
| December 31, 2012 | ||||||||||||||||||||||||
| U.S. government sponsored entities | $ | 3,492 | $ | (7 | ) | $ | - | $ | - | $ | 3,492 | $ | (7 | ) | ||||||||||
| Collateralized mortgage obligations and residential mortgage-backed securities | 2,294 | (15 | ) | - | - | 2,294 | (15 | ) | ||||||||||||||||
| Municipal securities | 3,330 | (28 | ) | - | - | 3,330 | (28 | ) | ||||||||||||||||
| Collateralized debt obligations | - | - | 1,392 | (3,816 | ) | 1,392 | (3,816 | ) | ||||||||||||||||
| Total temporarily impaired | $ | 9,116 | $ | (50 | ) | $ | 1,392 | $ | (3,816 | ) | $ | 10,508 | $ | (3,866 | ) | |||||||||
| Number of securities | 14 | 4 | 18 | |||||||||||||||||||||
Unrealized losses on securities have not been recognized into income because the securities are of high credit quality or have undisrupted cash flows. Management has the intent and ability to hold the securities for the foreseeable future, and the decline in fair value is largely due to changes in interest rates and volatility in the securities markets. The fair values are expected to recover as the securities approach maturity
NOTE 3 – Loans Receivable
Year end loans are summarized below:
| (Dollars in thousands) | ||||||||
| 2013 | 2012 | |||||||
| Loans secured by real estate: | ||||||||
| Construction and land development | $ | 21,462 | $ | 23,984 | ||||
| Residential, including home equity | 161,932 | 154,945 | ||||||
| Commercial real estate and other dwelling | 175,160 | 179,825 | ||||||
| Total loans secured by real estate | 358,554 | 358,754 | ||||||
| Consumer loans | 237 | 350 | ||||||
| Commercial business | 57,790 | 69,310 | ||||||
| Government and other | 21,587 | 8,869 | ||||||
| Subtotal | 438,168 | 437,283 | ||||||
| Less: | ||||||||
| Net deferred loan origination fees | (252 | ) | (251 | ) | ||||
| Undisbursed loan funds | (95 | ) | (51 | ) | ||||
| Loans receivable | $ | 437,821 | $ | 436,981 | ||||
| 25 |
The Bancorp’s activity in the allowance for loan losses, by loan segment, is summarized below for the years indicated.
| (Dollars in thousands) | Residential Real Estate, Including Home Equity | Consumer Loans | Commercial Real Estate, Construction & Land Development, and Other Dwellings | Commercial Participations Purchased | Commercial Business Loans | Government Loans | Total | |||||||||||||||||||||
| The Bancorp's activity in the allowance for loan losses is summarized below for the twelve months ended December 31, 2013: | ||||||||||||||||||||||||||||
| Allowance for loan losses: | ||||||||||||||||||||||||||||
| Beginning Balance | $ | 1,024 | $ | 19 | $ | 4,550 | $ | 1,608 | $ | 1,220 | $ | - | 8,421 | |||||||||||||||
| Charge-offs | (153 | ) | (17 | ) | (788 | ) | (332 | ) | (567 | ) | - | (1,857 | ) | |||||||||||||||
| Recoveries | 1 | 5 | 9 | 137 | 23 | - | 175 | |||||||||||||||||||||
| Provisions | 572 | 5 | 1,018 | (1,382 | ) | 183 | 54 | 450 | ||||||||||||||||||||
| Ending Balance | $ | 1,444 | $ | 12 | $ | 4,789 | $ | 31 | $ | 859 | $ | 54 | $ | 7,189 | ||||||||||||||
| The Bancorp's activity in the allowance for loan losses is summarized below for the twelve months ended December 31, 2012: | ||||||||||||||||||||||||||||
| Allowance for loan losses: | ||||||||||||||||||||||||||||
| Beginning Balance | $ | 1,161 | $ | 15 | $ | 3,329 | $ | 2,399 | $ | 1,101 | $ | - | $ | 8,005 | ||||||||||||||
| Charge-offs | (336 | ) | (17 | ) | (256 | ) | (873 | ) | (619 | ) | - | (2,101 | ) | |||||||||||||||
| Recoveries | 4 | 5 | 13 | 108 | 37 | - | 167 | |||||||||||||||||||||
| Provisions | 195 | 16 | 1,464 | (26 | ) | 701 | - | 2,350 | ||||||||||||||||||||
| Ending Balance | $ | 1,024 | $ | 19 | $ | 4,550 | $ | 1,608 | $ | 1,220 | $ | - | $ | 8,421 | ||||||||||||||
| The Bancorp's allowance for loan losses impairment evaluation and financing receivables are summarized below at December 31, 2013: | ||||||||||||||||||||||||||||
| Ending balance: individually evaluated for impairment | $ | 16 | $ | - | $ | 1,657 | $ | - | $ | 30 | $ | - | $ | 1,703 | ||||||||||||||
| Ending balance: collectively evaluated for impairment | $ | 1,428 | $ | 12 | $ | 3,132 | $ | 31 | $ | 829 | $ | 54 | $ | 5,486 | ||||||||||||||
| FINANCING RECEIVABLES | ||||||||||||||||||||||||||||
| Ending balance | $ | 161,664 | $ | 232 | $ | 195,349 | $ | 1,273 | $ | 57,716 | $ | 21,587 | $ | 437,821 | ||||||||||||||
| Ending balance: individually evaluated for impairment | $ | 887 | $ | - | $ | 8,446 | $ | - | $ | 534 | $ | - | $ | 9,867 | ||||||||||||||
| Ending balance: collectively evaluated for impairment | $ | 160,777 | $ | 232 | $ | 186,903 | $ | 1,273 | $ | 57,182 | $ | 21,587 | $ | 427,954 | ||||||||||||||
| The Bancorp's allowance for loan losses impairment evaluation and financing receivables are summarized below at December 31, 2012: | ||||||||||||||||||||||||||||
| Ending balance: individually evaluated for impairment | $ | 9 | $ | - | $ | 1,783 | $ | - | $ | 209 | $ | - | $ | 2,001 | ||||||||||||||
| Ending balance: collectively evaluated for impairment | $ | 1,015 | $ | 19 | $ | 2,767 | $ | 1,608 | $ | 1,011 | $ | - | $ | 6,420 | ||||||||||||||
| FINANCING RECEIVABLES | ||||||||||||||||||||||||||||
| Ending balance | $ | 154,627 | $ | 347 | $ | 175,769 | $ | 28,040 | $ | 69,329 | $ | 8,869 | $ | 436,981 | ||||||||||||||
| Ending balance: individually evaluated for impairment | $ | 692 | $ | - | $ | 10,778 | $ | 6,378 | $ | 2,032 | $ | - | $ | 19,880 | ||||||||||||||
| Ending balance: collectively evaluated for impairment | $ | 153,935 | $ | 347 | $ | 164,991 | $ | 21,662 | $ | 67,297 | $ | 8,869 | $ | 417,101 | ||||||||||||||
| 26 |
The Bancorp has established a standard loan grading system to assist management, lenders and review personnel in their analysis and supervision of the loan portfolio. The use and application of theses grades by the Bancorp is uniform and conforms to regulatory definitions. The loan grading system is as follows:
2 – Moderate risk
Borrower consistently internally generates sufficient cash flow to fund debt service, working assets, and some capital expenditures. Risk of default considered low.
3 – Acceptable risk
Borrower generates sufficient cash flow to fund debt service, but most working asset and all capital expansion needs are provided from external sources. Profitability ratios and key balance sheet ratios are usually close to peers but one or more ratios (e.g. leverage) may be higher than peer. Earnings may be trending down over the last three years. Borrower may be able to obtain similar financing from other banks with comparable or less favorable terms. Risk of default is acceptable but requires collateral protection.
4 – Pass/monitor
The borrower has significant weaknesses resulting from performance trends or management concerns. The financial condition of the company has taken a negative turn and may be temporarily strained. Cash flow may be weak but cash reserves remain adequate to meet debt service. Management weaknesses are evident. Borrowers in this category will warrant more than the normal level of supervision and more frequent reporting.
5 – Special mention (watch)
Special mention credits are considered bankable assets with no apparent loss of principal or interest envisioned but requiring a high level of management attention. Assets in this category are currently protected but are potentially weak. These borrowers are subject to economic, industry, or management factors having an adverse impact upon their prospects for orderly service of debt. The perceived risk in continued lending is considered to have increased beyond the level where such loans would normally be granted. These assets constitute an undue and unwarranted credit risk, but not to the point of justifying a classification of Substandard.
6 – Substandard
This classification consists of loans which are inadequately protected by the current sound worth and paying capacity of the obligor or of the collateral pledged. Financial statements normally reveal some or all of the following: poor trends, lack of earnings and cash flow, excessive debt, lack of liquidity, and the absence of creditor protection. Loans are still considered collectible, but due to increased risks and defined weaknesses of the credit, some loss could be incurred in collection if the deficiencies are not corrected.
7 – Doubtful
This classification consists of loans where the possibility of loss is high after collateral liquidation based upon existing facts, market conditions, and value. Loss is deferred until certain important and reasonably specific pending factors which may strengthen the credit can be exactly determined. These factors may include proposed acquisitions, liquidation procedures, capital injection and receipt of additional collateral, mergers or refinancing plans.
Performing loans are loans that are paying as agreed and are less than ninety days past due on payments of interest and principal.
The Bancorp's credit quality indicators, are summarized below at December 31:
| (Dollars in thousands) | ||||||||||||||||||||||||||||||||
| Corporate Credit Exposure - Credit Risk Portfolio By Creditworthiness Category | ||||||||||||||||||||||||||||||||
| Commercial
Real Estate, Construction & Land Development, and Other Dwellings | Commercial Participations Purchased | Commercial Business Loans | Government
Loans | |||||||||||||||||||||||||||||
| Loan Grades | 2013 | 2012 | 2013 | 2012 | 2013 | 2012 | 2013 | 2012 | ||||||||||||||||||||||||
| 2 Moderate risk | $ | - | $ | 19 | $ | - | $ | - | $ | 4,279 | $ | 5,674 | $ | - | $ | - | ||||||||||||||||
| 3 Acceptable risk | 150,303 | 110,416 | 1,013 | 15,585 | 41,474 | 45,202 | 21,587 | 8,869 | ||||||||||||||||||||||||
| 4 Pass/monitor | 33,153 | 51,100 | 260 | 1,029 | 11,173 | 13,500 | - | - | ||||||||||||||||||||||||
| 5 Special mention (watch) | 3,348 | 3,630 | - | 5,984 | 88 | 3,300 | - | - | ||||||||||||||||||||||||
| 6 Substandard | 8,545 | 10,604 | - | 5,442 | 702 | 1,653 | - | - | ||||||||||||||||||||||||
| 7 Doubtful | - | - | - | - | - | - | - | - | ||||||||||||||||||||||||
| Total | $ | 195,349 | $ | 175,769 | $ | 1,273 | $ | 28,040 | $ | 57,716 | $ | 69,329 | $ | 21,587 | $ | 8,869 | ||||||||||||||||
| (Dollars in thousands) | ||||||||||||||||||||||||||||||||
| Consumer Credit Exposure - Credit Risk Profile Based On Payment Activity | ||||||||||||||||||||||||||||||||
Residential Real Estate, Including Home Equity | Consumer Loans | |||||||||||||||||||||||||||||||
| 2013 | 2012 | 2013 | 2012 | |||||||||||||||||||||||||||||
| Performing | $ | 158,963 | $ | 152,838 | $ | 232 | $ | 337 | ||||||||||||||||||||||||
| Non-performing | 2,701 | 1,789 | - | 10 | ||||||||||||||||||||||||||||
| Total | $ | 161,664 | $ | 154,627 | $ | 232 | $ | 347 | ||||||||||||||||||||||||
| 27 |
The Bancorp's troubled debt restructurings for the periods presented are summarized below:
| (Dollars in thousands) | ||||||||||||||||||||||||
| Number of Contracts | Pre- Modification Outstanding Recorded Investment | Post- Modification Outstanding Recorded Investment | Number of Contracts | Pre- Modification Outstanding Recorded Investment | Post- Modification Outstanding Recorded Investment | |||||||||||||||||||
| December 31, 2013 | December 31, 2012 | |||||||||||||||||||||||
| Troubled debt restructurings during the period: | ||||||||||||||||||||||||
| Residential real estate, including home equity | 6 | $ | 792 | $ | 770 | 7 | $ | 700 | $ | 692 | ||||||||||||||
| Consumer loans | - | - | - | - | - | - | ||||||||||||||||||
| Commercial real estate, construction & land development, and other dwellings | - | - | - | 3 | 1,440 | 1,440 | ||||||||||||||||||
| Commercial participations purchased | - | - | - | 1 | 1,290 | 935 | ||||||||||||||||||
| Commercial business loans | - | - | - | 1 | 108 | 88 | ||||||||||||||||||
| Government loans | - | - | - | - | - | - | ||||||||||||||||||
| Number
of Contracts | Recorded Investment | Number
of Contracts | Recorded Investment | |||||||||||||||||||||
| December 31, 2013 | December 31, 2012 | |||||||||||||||||||||||
| Troubled debt restructurings that subsequently defaulted during the periods presented: | ||||||||||||||||||||||||
| Residential real estate, including home equity | 1 | $ | 106 | 1 | $ | 39 | ||||||||||||||||||
| Consumer loans | - | - | - | - | ||||||||||||||||||||
| Commercial real estate, construction & land | 1 | $ | 707 | |||||||||||||||||||||
| development, and other dwellings | - | - | - | - | ||||||||||||||||||||
| Commercial participations purchased | - | - | - | - | ||||||||||||||||||||
| Commercial business loans | - | - | - | - | ||||||||||||||||||||
| Government loans | - | - | - | - | ||||||||||||||||||||
All of the loans classified as troubled debt restructurings are also considered impaired. The valuation basis for the Bancorp’s troubled debt restructurings is based on the present value of cash flows, unless consistent cash flows are not present, then the fair value of the collateral securing the loan is the basis for valuation. Troubled debt restructurings that subsequently defaulted during the period are loans that were restructured and, subsequent to restructuring, were moved to nonaccrual status and failed to comply with the guidelines of the restructured note. Troubled debt restructurings that subsequently defaulted are presented for comparison purposes and are relevant only to the period in which the subsequent default occurred.
| 28 |
The Bancorp's individually evaluated impaired loans are summarized below:
| As of December 31, 2013 | For the twelve months ended December 31, 2013 | |||||||||||||||||||
| (Dollars in thousands) | Recorded Investment | Unpaid Principal Balance | Related Allowance | Average Recorded Investment | Interest Income Recognized | |||||||||||||||
| With no related allowance recorded: | ||||||||||||||||||||
| Residential real estate, including home equity | $ | - | $ | - | $ | - | $ | - | $ | - | ||||||||||
| Commercial real estate, construction & land development, and other dwellings | 617 | 617 | - | 898 | 9 | |||||||||||||||
| Commercial participations purchased | - | - | - | 2,469 | - | |||||||||||||||
| Commercial business loans | 228 | 228 | - | 668 | 1 | |||||||||||||||
| With an allowance recorded: | ||||||||||||||||||||
| Residential real estate, including home equity | 887 | 899 | 16 | 920 | 9 | |||||||||||||||
| Commercial real estate, construction & land development, and other dwellings | 7,829 | 7,829 | 1,657 | 8,770 | 74 | |||||||||||||||
| Commercial participations purchased | - | - | - | 189 | - | |||||||||||||||
| Commercial business loans | 306 | 574 | 30 | 454 | 1 | |||||||||||||||
| Total: | ||||||||||||||||||||
| Residential real estate, including home equity | $ | 887 | $ | 899 | $ | 16 | $ | 920 | $ | 9 | ||||||||||
| Commercial real estate, construction & land development, and other dwellings | $ | 8,446 | $ | 8,446 | $ | 1,657 | $ | 9,668 | $ | 83 | ||||||||||
| Commercial participations purchased | $ | - | $ | - | $ | - | $ | 2,658 | $ | - | ||||||||||
| Commercial business loans | $ | 534 | $ | 802 | $ | 30 | $ | 1,122 | $ | 2 | ||||||||||
| As of December 31, 2012 | For the twelve months ended December 31, 2012 | |||||||||||||||||||
| (Dollars in thousands) | Recorded Investment | Unpaid Principal Balance | Related Allowance | Average Recorded Investment | Interest Income Recognized | |||||||||||||||
| With no related allowance recorded: | ||||||||||||||||||||
| Residential real estate, including home equity | $ | - | $ | - | $ | - | $ | - | $ | - | ||||||||||
| Commercial real estate, construction & land development, and other dwellings | 591 | 591 | - | 652 | 3 | |||||||||||||||
| Commercial participations purchased | 6,378 | 11,047 | - | 5,080 | - | |||||||||||||||
| Commercial business loans | 727 | 1,000 | - | 992 | 32 | |||||||||||||||
| With an allowance recorded: | ||||||||||||||||||||
| Residential real estate, including home equity | 692 | 692 | 9 | 782 | 20 | |||||||||||||||
| Commercial real estate, construction & land development, and other dwellings | 10,187 | 10,271 | 1,783 | 10,207 | 349 | |||||||||||||||
| Commercial participations purchased | - | - | - | 1,394 | - | |||||||||||||||
| Commercial business loans | 1,305 | 1,305 | 209 | 874 | 51 | |||||||||||||||
| Total: | ||||||||||||||||||||
| Residential real estate, including home equity | $ | 692 | $ | 692 | $ | 9 | $ | 782 | $ | 20 | ||||||||||
| Commercial real estate, construction & land development, and other dwellings | $ | 10,778 | $ | 10,862 | $ | 1,783 | $ | 10,859 | $ | 352 | ||||||||||
| Commercial participations purchased | $ | 6,378 | $ | 11,047 | $ | - | $ | 6,474 | $ | - | ||||||||||
| Commercial business loans | $ | 2,032 | $ | 2,305 | $ | 209 | $ | 1,866 | $ | 83 | ||||||||||
| 29 |
The Bancorp's age analysis of past due loans is summarized below:
| (Dollars in thousands) | ||||||||||||||||||||||||||||
| 30-59 Days Past Due | 60-89 Days Past Due | Greater Than 90 Days Past Due | Total Past Due | Current | Total Loans | Recorded Investments Greater than 90 Days and Accruing | ||||||||||||||||||||||
| December 31, 2013 | ||||||||||||||||||||||||||||
| Residential real estate, including home equity | $ | 3,721 | $ | 1,090 | $ | 1,502 | $ | 6,313 | $ | 155,351 | $ | 161,664 | $ | 174 | ||||||||||||||
| Consumer loans | 1 | - | - | 1 | 231 | 232 | - | |||||||||||||||||||||
| Commercial real estate, construction & land development, and other dwellings | 1,083 | 2,626 | 768 | 4,477 | 190,872 | 195,349 | - | |||||||||||||||||||||
| Commercial participations purchased | - | - | - | - | 1,273 | 1,273 | - | |||||||||||||||||||||
| Commercial business loans | 1,032 | 25 | 447 | 1,504 | 56,212 | 57,716 | - | |||||||||||||||||||||
| Government loans | - | - | - | - | 21,587 | 21,587 | - | |||||||||||||||||||||
| Total | $ | 5,837 | $ | 3,741 | $ | 2,717 | $ | 12,295 | $ | 425,526 | $ | 437,821 | $ | 174 | ||||||||||||||
| December 31, 2012 | ||||||||||||||||||||||||||||
| Residential real estate, including home equity | $ | 4,172 | $ | 1,145 | $ | 1,448 | $ | 6,765 | $ | 147,862 | $ | 154,627 | $ | - | ||||||||||||||
| Consumer loans | - | - | - | - | 347 | 347 | - | |||||||||||||||||||||
| Commercial real estate, construction & land development, and other dwellings | 4,044 | 390 | 1,993 | 6,427 | 169,342 | 175,769 | 229 | |||||||||||||||||||||
| Commercial participations purchased | 5 | - | 5,442 | 5,447 | 22,593 | 28,040 | - | |||||||||||||||||||||
| Commercial business loans | 689 | 116 | 1,525 | 2,330 | 66,999 | 69,329 | - | |||||||||||||||||||||
| Government loans | - | - | - | - | 8,869 | 8,869 | - | |||||||||||||||||||||
| Total | $ | 8,910 | $ | 1,651 | $ | 10,408 | $ | 20,969 | $ | 416,012 | $ | 436,981 | $ | 229 | ||||||||||||||
The Bancorp's loans on nonaccrual status are summarized below:
| (Dollars in thousands) | ||||||||
| December 31, 2013 | December 31, 2012 | |||||||
| Residential real estate, including home equity | $ | 2,526 | $ | 1,846 | ||||
| Consumer loans | - | 10 | ||||||
| Commercial real estate, construction & land development, and other dwellings | 807 | 2,311 | ||||||
| Commercial participations purchased | - | 5,442 | ||||||
| Commercial business loans | 447 | 1,644 | ||||||
| Government loans | - | - | ||||||
| Total | $ | 3,780 | $ | 11,253 | ||||
During the second quarter of 2012, the Bancorp conducted a $3.4 million sale of portfolio fixed rate mortgage loans, which the Bancorp’s management considers an interest rate risk mitigation strategy to reduce loan prepayment risk. The segment of loans that were sold had a higher premium value and were projected to prepay significantly faster than the mortgage portfolio's average repayment speed. The gain realized from the prepayment risk reduction strategy totaled $183 thousand and was recorded during the second quarter of 2012. The proceeds from the loan sale were used to fund loans with longer durations and similar yields to the loans that were included in the sales strategy.
Note 4 – Premises and Equipment, Net
At year end, premises and equipment are summarized as follows:
| (Dollars in thousands) | ||||||||
| 2013 | 2012 | |||||||
| Cost: | ||||||||
| Land | $ | 4,540 | $ | 4,540 | ||||
| Buildings and improvements | 19,588 | 19,277 | ||||||
| Furniture and equipment | 11,786 | 11,244 | ||||||
| Total cost | 35,914 | 35,061 | ||||||
| Less accumulated depreciation | (18,654 | ) | (17,383 | ) | ||||
| Premises and equipment, net | $ | 17,260 | $ | 17,678 | ||||
Depreciation expense was approximately $1,312,000 and $1,361,000 for 2013 and 2012, respectively.
Note 5 – Foreclosed Real Estate
At year end, foreclosed real estate is summarized below:
| (Dollars in thousands) | ||||||||
| 2013 | 2012 | |||||||
| Residential real estate | $ | 94 | $ | 243 | ||||
| Commercial real estate and other dwellings. | 716 | 151 | ||||||
| Construction and land development | 274 | 31 | ||||||
| Total | $ | 1,084 | $ | 425 | ||||
| 30 |
Note 6 – Income Taxes
At year-end, components of the income tax expense consist of the following:
| (Dollars in thousands) | ||||||||
| 2013 | 2012 | |||||||
| Federal: | ||||||||
| Current | $ | 1,844 | $ | 1,754 | ||||
| Deferred | 276 | 146 | ||||||
| State: | ||||||||
| Current | 44 | 35 | ||||||
| Deferred, net of valuation allowance | 233 | 6 | ||||||
| Income tax expense | $ | 2,397 | $ | 1,941 | ||||
Effective tax rates differ from the federal statutory rate of 34% applied to income before income taxes due to the following:
| (Dollars in thousands) | ||||||||
| 2013 | 2012 | |||||||
| Federal statutory rate | 34 | % | 34 | % | ||||
| Tax expense at statutory rate | $ | 3,235 | $ | 2,990 | ||||
| State tax, net of federal effect | 183 | 27 | ||||||
| Tax exempt income | (940 | ) | (806 | ) | ||||
| Bank owned life insurance | (129 | ) | (329 | ) | ||||
| Tax credits | - | - | ||||||
| Other | 48 | 59 | ||||||
| Total income tax expense | $ | 2,397 | $ | 1,941 | ||||
At year-end, the components of the net deferred tax asset recorded in the consolidated balance sheets are as follows:
| (Dollars in thousands) | ||||||||
| 2013 | 2012 | |||||||
| Deferred tax assets: | ||||||||
| Bad debts | $ | 2,754 | $ | 3,318 | ||||
| Deferred loan fees | 96 | 99 | ||||||
| Deferred compensation | 483 | 486 | ||||||
| Unrealized depreciation on securities available-for-sale, net | 1,620 | - | ||||||
| Net operating loss | 642 | 875 | ||||||
| Tax credits | 78 | 73 | ||||||
| Nonaccrual loan interest income | 87 | 12 | ||||||
| Restricted stock awards | 35 | 26 | ||||||
| REO writedowns | 25 | 11 | ||||||
| Unqualified DCP | 60 | 55 | ||||||
| Post retirement benefit | 52 | 55 | ||||||
| Other-than-temporary impairment | 92 | 92 | ||||||
| Accrued vacation | 111 | 125 | ||||||
| Impairment on land | 75 | 75 | ||||||
| Other | 19 | 20 | ||||||
| Total deferred tax assets | 6,229 | 5,322 | ||||||
| Deferred tax liabilities: | ||||||||
| Depreciation | (1,232 | ) | (1,284 | ) | ||||
| Prepaids | (270 | ) | (272 | ) | ||||
| Mortgage servicing rights | (105 | ) | (133 | ) | ||||
| Deferred stock dividends | (112 | ) | (115 | ) | ||||
| Unrealized appreciation on securities available-for-sale, net | - | (1,246 | ) | |||||
| Post retirement unrealized gain | (42 | ) | (40 | ) | ||||
| Other | (83 | ) | (16 | ) | ||||
| Total deferred tax liabilities | (1,844 | ) | (3,106 | ) | ||||
| Valuation allowance | (288 | ) | (474 | ) | ||||
| Net deferred tax assets | $ | 4,097 | $ | 1,742 | ||||
At December 31, 2013, the Bancorp has a state net operating loss carry forward of approximately $13.9 million which will begin to expire in 2022 if not used. The Bancorp also has a state tax credit carry forward of approximately $119,000 which will begin to expire in 2017 if not used. A valuation allowance of $288,000 and $474,000 was provided at December 31, 2013 and 2012, respectively, for the state net operating loss and state tax credit.
The Bancorp qualified under provisions of the Internal Revenue Code, to deduct from taxable income a provision for bad debts in excess of the provision for such losses charged to income in the financial statements, if any. Accordingly, retained earnings at December 31, 2013 and 2012 includes, approximately $5,982,000 for which no provision for federal income taxes has been made. If, in the future this portion of retained earnings is used for any purpose other than to absorb bad debt losses, federal income taxes would be imposed at the then applicable rate. The unrecorded deferred income tax liability on the above amounts was approximately $2,034,000 at December 31, 2013 and 2012.
The Bancorp had no unrecognized tax benefits at any time during 2013 or 2012 and does not anticipate any significant increase or decrease in unrecognized tax benefits during 2014. Should the accrual of any interest or penalties relative to unrecognized tax benefits be necessary, it is the Bancorp's policy to record such accruals through income tax accounts. No such accruals existed at any time during 2013 or 2012.
The Bancorp and its subsidiaries are subject to United States Federal income tax as well as income tax of the states of Indiana and Illinois. The Bancorp is no longer subject to examination by taxing authorities for the years before 2010 for federal and 2009 for state.
Note 7 – Deposits
The aggregate amount of certificates of deposit with a balance of $250,000 or more was approximately $19,787,000 at December 31, 2013 and $20,919,000 at December 31, 2012.
At December 31, 2013, scheduled maturities of certificates of deposit were as follows:
| (Dollars in thousands) | ||||
| 2014 | $ | 131,508 | ||
| 2015 | 21,032 | |||
| 2016 | 1,631 | |||
| 2017 | 1,445 | |||
| Thereafter | - | |||
| Total | $ | 155,616 | ||
| 31 |
Note 8 – Borrowed Funds
At year end, borrowed funds are summarized below:
| (Dollars in thousands) | ||||||||
| 2013 | 2012 | |||||||
| Fixed rate advances from the FHLB | 30,100 | 28,000 | ||||||
| Putable advances from the FHLB | - | 5,000 | ||||||
| Line of credit at FHLB | 714 | - | ||||||
| Other | 84 | 207 | ||||||
| Total | $ | 30,898 | $ | 33,207 | ||||
At December 31, 2013, scheduled maturities of borrowed funds were as follows:
| (Dollars in thousands) | ||||
| 2014 | $ | 8,798 | ||
| 2015 | 6,000 | |||
| 2016 | 6,000 | |||
| 2017 | 8,000 | |||
| 2018 | 2,100 | |||
| Total | $ | 30,898 | ||
Repurchase agreements generally mature within one year and are secured by U.S. government and U.S. agency securities, under the Bancorp’s control. At year end, information concerning these retail repurchase agreements is summarized below:
| (Dollars in thousands) | ||||||||
| 2013 | 2012 | |||||||
| Ending balance | $ | 14,031 | $ | 16,298 | ||||
| Average balance during the year | 18,016 | 20,561 | ||||||
| Maximum month-end balance during the year | 21,652 | 25,278 | ||||||
| Securities underlying the agreements at year end: | ||||||||
| Carrying value | 23,729 | 28,002 | ||||||
| Fair value | 23,729 | 28,002 | ||||||
| Average interest rate during the year | 0.38 | % | 0.38 | % | ||||
| Average interest rate at year end | 0.38 | % | 0.31 | % | ||||
At year-end, advances from the Federal Home Loan Bank were as follows:
| (Dollars in thousands) | ||||||||
| 2013 | 2012 | |||||||
| Fixed rate advances, maturing January 2014 through November 2018 at rates from 0.61% to 2.56%; average rate: 2013 – 1.47%; 2012 – 1.84% | $ | 30,100 | $ | 28,000 | ||||
| Putable advance, maturing February 2013 at a fixed rate of 2.62% | - | 5,000 | ||||||
Fixed rate advances are payable at maturity, with a prepayment penalty. Putable advances are fixed for a period of one to three years and then may adjust quarterly to the three-month London Interbank Offered Rate until maturity. Once the putable advance interest rate adjusts, the Bancorp has the option to prepay the advance on specified quarterly interest rate reset dates. The advances were collateralized by mortgage loans totaling approximately $188,810,000 and $164,463,000 at December 31, 2013 and 2012, respectively. In addition to the fixed rate and putable advances, the Bancorp maintains a $10,000,000 line of credit with the Federal Home Loan Bank of Indianapolis. There was approximately $714,000 outstanding on the line of credit at December 31, 2013 and no balance outstanding at December 31, 2012. Other borrowings at December 31, 2013 and 2012 are comprised of reclassified bank balances.
Note 9 – Employees’ Benefit Plans
The Bancorp maintains an Employees’ Savings and Profit Sharing Plan and Trust for all employees who meet the plan qualifications. Employees are eligible to participate in the Employees’ Savings and Profit Sharing Plan and Trust on the next January 1 or July 1 following the completion of one year of employment, age 18, and completion of 1,000 hours of service. The Employees’ Savings Plan feature allows employees to make pre-tax contributions to the Employees’ Savings Plan of 1% to 50% of Plan Salary, subject to limitations imposed by Internal Revenue Code section 401(k). The Profit Sharing Plan and Trust feature is non-contributory on the part of the employee. Contributions to the Employees’ Profit Sharing Plan and Trust are made at the discretion of the Bancorp’s Board of Directors. Contributions for the year ended December 31, 2013 and 2012 were both based on 9% of the participants’ total compensation, excluding incentives. Participants in the plan become 100% vested upon completion of five years of service. The benefit plan expense amounted to approximately $636,000 for 2013 and $677,000 for 2012.
The Bancorp maintains an Unqualified Deferred Compensation Plan (the Plan). The purpose of the Plan is to provide deferred compensation to key senior management employees of the Bancorp in order to recognize their substantial contributions to the Bank and provide them with additional financial security as inducement to remain with the Bank. The Compensation Committee selects which persons shall be participants in the Plan. Participants’ accounts are credited each year with an amount based on a formula involving the participant’s employer funded contributions under all qualified plans and the limitations imposed by Internal Revenue Code subsection 401(a)(17) and Code section 415. The unqualified deferred compensation plan liability at December 31, 2013 and 2012 was approximately $156,000 and $141,000, respectively. The Plan expense amounted to $15,000 for 2013 and $14,000 for 2012.
Directors have deferred some of their fees in consideration of future payments. Fee deferrals, including interest, totaled approximately $96,000 and $91,000 for 2013 and 2012, respectively. The deferred fee liability at December 31, 2013 and 2012 was approximately $1,264,000 and $1,234,000, respectively.
| 32 |
Note 10 – Regulatory Capital
The Bancorp and Bank are subject to regulatory capital requirements administered by federal banking agencies. Capital adequacy guidelines and prompt corrective action regulations involve quantitative measures of assets, liabilities, and certain off-balance-sheet items calculated under regulatory accounting practices. Capital amounts and classifications are also subject to qualitative judgments by regulators. Failure to meet various capital requirements can initiate regulatory action. Prompt corrective action regulations provide five classifications, including well capitalized, adequately capitalized, undercapitalized, significantly undercapitalized, and critically undercapitalized, although these terms are not used to represent overall financial condition. If adequately capitalized, regulatory approval is required to accept brokered deposits. If undercapitalized, capital distributions are limited, as is asset growth and expansion, and capital restoration plans are required. At December 31, 2013 and 2012, the most recent regulatory notifications categorized the Bancorp and Bank as well capitalized under the regulatory framework for prompt corrective action. There are no conditions or events since that notification that management believes have changed the Bancorp’s or the Bank’s category.
At year-end, capital levels for the Bancorp and the Bank were essentially the same. Actual capital levels (in millions), minimum required levels and levels needed to be classified as well capitalized for the Bancorp are summarized below:
| Minimum | ||||||||||||||||||||||||
| Required To Be | ||||||||||||||||||||||||
| Well Capitalized | ||||||||||||||||||||||||
| Minimum Required | Under Prompt | |||||||||||||||||||||||
| For Capital | Corrective | |||||||||||||||||||||||
| Actual | Adequacy Purposes | Action Regulations | ||||||||||||||||||||||
| (Dollars in millions) | Amount | Ratio | Amount | Ratio | Amount | Ratio | ||||||||||||||||||
| 2013 | ||||||||||||||||||||||||
| Total capital to risk-weighted assets | $ | 75.0 | 15.6 | % | $ | 38.5 | 8.0 | % | $ | 48.2 | 10.0 | % | ||||||||||||
| Tier 1 capital to risk-weighted assets | $ | 69.0 | 14.3 | % | $ | 19.3 | 4.0 | % | $ | 28.9 | 6.0 | % | ||||||||||||
| Tier 1 capital to adjusted average assets. | $ | 69.0 | 10.0 | % | $ | 20.8 | 3.0 | % | $ | 34.6 | 5.0 | % | ||||||||||||
| 2012 | ||||||||||||||||||||||||
| Total capital to risk-weighted assets | $ | 70.1 | 14.6 | % | $ | 38.3 | 8.0 | % | $ | 47.9 | 10.0 | % | ||||||||||||
| Tier 1 capital to risk-weighted assets | $ | 64.1 | 13.4 | % | $ | 19.1 | 4.0 | % | $ | 28.7 | 6.0 | % | ||||||||||||
| Tier 1 capital to adjusted average assets. | $ | 64.1 | 9.4 | % | $ | 20.5 | 3.0 | % | $ | 34.2 | 5.0 | % | ||||||||||||
The Bancorp’s ability to pay dividends to its shareholders is entirely dependent upon the Bank’s ability to pay dividends to the Bancorp. Under Indiana law, the Bank may pay dividends from its undivided profits (generally, earnings less losses, bad debts, taxes and other operating expenses) as is considered expedient by the Bank’s Board of Directors. However, the Bank must obtain the approval of the Indiana Department of Financial Institutions (DFI) for the payment of a dividend if the total of all dividends declared by the Bank during the current year, including the proposed dividend, would exceed the sum of retained net income for the year to date plus its retained net income for the previous two years. For this purpose, “retained net income,” means net income as calculated for call report purposes, less all dividends declared for the applicable period. The aggregate amount of dividends that may be declared by the Bank in 2014, without prior DFI approval is $9.4 million plus 2014 net profits. Moreover, the FDIC and the Federal Reserve Board may prohibit the payment of dividends if it determines that the payment of dividends would constitute an unsafe or unsound practice in light of the financial condition of the Bank. On November 22, 2013, the Board of Directors of the Bancorp declared a fourth quarter dividend of $0.22 per share. The Bancorp’s fourth quarter dividend was paid to shareholders on January 2, 2014.
Note 11 – Stock Based Compensation
The Bancorp’s 2004 Stock Option Plan (the Plan), which is stockholder-approved, permits the grant of share options to its employees for up to 250,000 shares of common stock. Awards granted under the Plan may be in the form of incentive stock options, non-incentive stock options, or restricted stock. The purposes of the Plan are to attract and retain the best available personnel, to provide additional incentives for all employees and to encourage their continued employment by facilitating employees’ purchases of an equity interest in the Bancorp. Option awards are generally granted with an exercise price equal to the market price of the Bancorp’s common stock at the date of grant; those option awards have five year vesting periods and have ten year contractual terms. No expense was charged against income for incentive stock options during 2013. Total compensation cost that has been charged against income for incentive stock options was approximately $1,000 for 2012.
The fair value of each incentive stock option award is estimated on the date of grant using a closed form option valuation (Black-Scholes) model. Expected volatilities are based on historical volatilities of the Company’s common stock. No incentive stock options were granted during 2013 or 2012. The Company uses historical data to estimate option exercise and post-vesting termination behavior. The expected term of options granted is based on historical data and represents the period of time that options granted are expected to be outstanding, which takes into account that the options are not transferable. The risk-free interest rate for the expected term of the option is based on the U.S. Treasury yield curve in effect at the time of the grant.
| 33 |
A summary of the Bancorp’s stock option activity for 2013 and 2012 follows:
| Shares | Weighted Average Exercise Price | Weighted Average Remaining Contractual Term (Years) | Aggregate Intrinsic Value | |||||||||||||
| Outstanding at January 1, 2012 | 40,500 | $ | 25.30 | |||||||||||||
| Granted | - | - | ||||||||||||||
| Exercised | - | - | ||||||||||||||
| Forfeited or expired | (14,550 | ) | 22.15 | |||||||||||||
| Outstanding at end of year | 25,950 | $ | 27.06 | 0.7 | $ | - | ||||||||||
| Vested or expected to vest | 25,950 | $ | 27.06 | 0.7 | $ | - | ||||||||||
| Exercisable at December 31, 2012 | 24,950 | $ | 27.01 | 0.5 | $ | - | ||||||||||
| Outstanding at January 1, 2013 | 25,950 | 27.06 | ||||||||||||||
| Granted | - | - | ||||||||||||||
| Exercised | - | - | ||||||||||||||
| Forfeited or expired | (19,600 | ) | 26.17 | |||||||||||||
| Outstanding at end of year | 6,350 | $ | 29.82 | 0.5 | $ | - | ||||||||||
| Vested or expected to vest | 6,350 | $ | 29.82 | 0.5 | $ | - | ||||||||||
| Exercisable at December 31, 2013 | 6,350 | $ | 29.82 | 0.5 | $ | - | ||||||||||
As of December 31, 2013, there were no unrecognized compensation costs related to non-vested incentive stock options granted under the Plan.
Restricted stock awards are generally granted with an award price equal to the market price of the Bancorp’s common stock on the award date. Restricted stock awards have been issued with a five year vesting period. Forfeiture provisions exist for personnel that separate employment before the vesting period expires. Compensation expense related to restricted stock awards are recognized over the vesting period. Total compensation cost that has been charged against income for those plans was approximately $40,000 and $15,000 for 2013 and 2012, respectively.
A summary of changes in the Bancorp’s non-vested restricted stock for 2013 and 2012 follows:
| Non-vested Shares | Shares | Weighted Average Grant Date Fair Value | ||||||
| Non-vested at January 1, 2012 | 3,750 | $ | 25.72 | |||||
| Granted | - | - | ||||||
| Vested | (350 | ) | 29.75 | |||||
| Forefited | - | $ | - | |||||
| Non-vested at December 31, 2012 | 3,400 | 20.15 | ||||||
| Non-vested at January 1, 2013 | 3,400 | $ | 20.15 | |||||
| Granted | 8,450 | 22.49 | ||||||
| Vested | (600 | ) | 27.25 | |||||
| Forefited | (150 | ) | 21.00 | |||||
| Non-vested at December 31, 2013 | 11,100 | $ | 21.54 | |||||
As of December 31, 2013, there was approximately $165,000 of total unrecognized compensation cost related to non-vested restricted shares granted under the Plan. The cost is expected to be recognized over a weighted-average period of 3.4 years.
Note 12 – Earnings per Common Share
A reconciliation of the numerators and denominators of the basic earnings per common share and diluted earnings per common share computations for 2013 and 2012 is presented below.
| 2013 | 2012 | |||||||
| Basic earnings per common share: | ||||||||
| Net income available to common stockholders | $ | 7,117,709 | $ | 6,852,915 | ||||
| Weighted-average common shares outstanding | 2,841,990 | 2,839,719 | ||||||
| Basic earnings per common share | $ | 2.50 | $ | 2.41 | ||||
| Diluted earnings per common share: | ||||||||
| Net income available to common stockholders | $ | 7,117,709 | $ | 6,852,915 | ||||
| Weighted-average common shares outstanding | 2,841,990 | 2,839,719 | ||||||
| Weighted-average common and dilutive potential common shares outstanding | 2,841,990 | 2,839,719 | ||||||
| Diluted earnings per common share | $ | 2.50 | $ | 2.41 | ||||
There were 6,350 and 25,950 anti-dilutive shares outstanding at December 31, 2013 and 2012, respectively.
Note 13 – Related Party Transactions
The Bancorp had aggregate loans outstanding to directors and executive officers (with individual balances exceeding $120,000) of approximately $4,900,000 at December 31, 2013 and approximately $4,036,000 at December 31, 2012. For the year ended December 31, 2013, the following activity occurred on these loans:
| (Dollars in thousands) | ||||
| Aggregate balance at the beginning of the year | $ | 4,036 | ||
| New loans | 2,004 | |||
| Repayments | (1,140 | ) | ||
| Aggregate balance at the end of the year | $ | 4,900 | ||
Deposits from directors and executive officers totaled approximately $3,897,000 and $2,774,000 at December 31, 2013 and 2012, respectively.
| 34 |
Note 14 – Commitments and Contingencies
The Bancorp is a party to financial instruments in the normal course of business to meet the financing needs of its customers. These financial instruments, which include commitments to make loans and standby letters of credit, are not reflected in the accompanying consolidated financial statements. Such financial instruments are recorded when they are funded.
The Bancorp’s exposure to credit loss in the event of non-performance by the other party to the financial instrument for commitments to originate loans and standby letters of credit is represented by the contractual amount of those instruments. Commitments generally have fixed expiration dates or other termination clauses and may require the payment of a fee. The Bancorp uses the same credit policy to make such commitments as it uses for on-balance sheet items. Since commitments to make loans may expire without being used, the amount does not necessarily represent future cash commitments.
The Bancorp had outstanding commitments to originate loans as follows:
| (Dollars in thousands) | ||||||||||||
| Fixed | Variable | |||||||||||
| Rate | Rate | Total | ||||||||||
| December 31, 2013: | ||||||||||||
| Commercial business | $ | 1,912 | $ | 29,282 | $ | 31,194 | ||||||
| Real estate | 22,543 | 14,290 | 36,833 | |||||||||
| Consumer loans | - | - | - | |||||||||
| Government loans | - | - | - | |||||||||
| Unsecured consumer overdrafts | 10,734 | - | 10,734 | |||||||||
| Total | $ | 35,189 | $ | 43,572 | $ | 78,761 | ||||||
| December 31, 2012: | ||||||||||||
| Commercial business | $ | 2,334 | $ | 26,673 | $ | 29,007 | ||||||
| Real estate | 15,979 | 8,581 | 24,560 | |||||||||
| Consumer loans | - | - | - | |||||||||
| Government loans | 4,941 | - | 4,941 | |||||||||
| Unsecured consumer overdrafts | 10,812 | - | 10,812 | |||||||||
| Total | $ | 34,066 | $ | 35,254 | $ | 69,320 | ||||||
The approximately $35,189,000 in fixed rate commitments outstanding at December 31, 2013 and the approximately $34,066,000 in fixed rate commitments outstanding at December 31, 2012 had interest rates ranging from 2.30% to 10.00%, for a period not to exceed forty-five days. Mortgage interest rate locks with borrowers are a component of real estate commitments, were treated as derivative transactions, and valued accordingly at year-end.
Standby letters of credit are conditional commitments issued by the Bancorp to guarantee the performance of a customer to a third party. At December 31, 2013 and 2012, the Bancorp had standby letters of credit totaling approximately $8,226,000 and $9,251,000, respectively which are not included in the tables above. The Bancorp evaluates each customer’s creditworthiness on a case-by-case basis. The amount of collateral obtained, if deemed necessary by the Bancorp upon extension of credit, is based on management’s credit evaluation of the borrower. Collateral obtained may include accounts receivable, inventory, property, land or other assets.
Note 15 – Fair Values of Financial Instruments
The Fair Value Measurements Topic (the Topic) establishes a hierarchy that requires an entity to maximize the use of observable inputs and minimize the use of unobservable inputs when measuring fair value. The Topic describes three levels of inputs that may be used to measure fair value:
Level 1: Quoted prices (unadjusted) for identical assets or liabilities in active markets that the entity has the ability to access as of the measurement date.
Level 2: Significant other observable inputs other than Level 1 prices such as quoted prices for similar assets or liabilities; quoted prices in markets that are not active; or other inputs that are observable or can be corroborated by observable market data.
Level 3: Significant unobservable inputs that reflect a reporting entity’s own assumptions about the assumptions that market participants would use in pricing an asset or liability.
The fair values of securities available for sale are determined on a recurring basis by obtaining quoted prices on nationally recognized securities exchanges or pricing models utilizing significant observable inputs such as matrix pricing, which is a mathematical technique widely used in the industry to value debt securities without relying exclusively on quoted prices for the specific securities, but rather by relying on the securities’ relationship to other benchmark quoted securities. Different judgment and assumptions used in pricing could result in different estimates of value. In certain cases where market data is not readily available because of lack of market activity or little public disclosure, values may be based on unobservable inputs and classified in Level 3 of the fair value hierarchy.
At the end of each reporting period, securities held in the investment portfolio are evaluated on an individual security level for other-than-temporary impairment in accordance with the Investments – Debt and Equity Securities Topic. Impairment is other-than-temporary if the decline in the fair value of the security is below its amortized cost and it is probable that all amounts due according to the contractual terms of a debt security will not be received. Significant judgments are required in determining impairment, which include making assumptions regarding the estimated prepayments, loss assumptions and the change in interest rates. The Bancorp considers the following factors when determining other-than-temporary impairment for a security: the length of time and the extent to which the market value has been less than amortized cost; the financial condition and near-term prospects of the issuer; the underlying fundamentals of the relevant market and the outlook for such market for the near future; an assessment of whether the Bancorp (1) has the intent to sell the debt securities or (2) more likely than not will be required to sell the debt securities before their anticipated market recovery. If either of these conditions are met, management will recognize other-than-temporary impairment. If, in management’s judgment, an other-than-temporary impairment exists, the cost basis of the security will be written down for the credit loss, and the unrealized loss will be transferred from accumulated other comprehensive loss as an immediate reduction of current earnings.
| 35 |
For the years ended December 31, 2013 and 2012, the Bancorp’s management utilized a specialist to perform an other-than-temporary impairment analysis for each of its four pooled trust preferred securities. The analysis utilizes analytical models used to project future cash flows for the pooled trust preferred securities based on current assumptions for prepayments, default and deferral rates, and recoveries. The projected cash flows are then tested for impairment consistent with the Investments – Other Topic and the Investments – Debt and Equity Securities Topic. The other-than-temporary impairment testing compares the present value of the cash flows from quarter to quarter to determine if there is a “favorable” or “adverse” change. Other-than-temporary impairment is recorded if the projected present value of cash flows is lower than the book value of the security. To perform the quarterly other-than-temporary impairment analysis, management utilizes current reports issued by the trustee, which contain principal and interest tests, waterfall distributions, note valuations, collection detail and credit ratings for each pooled trust preferred security. In addition, a detailed review of the performing collateral was performed. The review of the collateral began with a review of financial information provided by SNL Financial, a comprehensive database, widely used in the industry, which gathers financial data on banks and thrifts from U.S. GAAP financial statements for public companies (annual and quarterly reports on Forms 10-K and 10-Q), as well as regulatory reports for private companies, including consolidated financial statements for bank holding companies (FR Y-9C reports) and parent company-only financial statements for bank holding companies (FR Y-9LP reports) filed with the Federal Reserve and bank call reports filed with the FDIC and OCC. Using the information sources described above, for each bank and thrift examined, the following items were examined: nature of the issuer’s business, years of operating history, corporate structure, loan composition and loan concentrations, deposit mix, asset growth rates, geographic footprint and local economic environment. The issuers’ historical financial performance was reviewed and their financial ratios were compared to appropriate peer groups of regional banks or thrifts with similar asset sizes. The analysis focused on six broad categories: profitability (revenue streams and earnings quality, return on assets and shareholder’s equity, net interest margin and interest rate sensitivity), credit quality (charge-offs and recoveries, non-current loans and total non-performing assets as a percentage of total loans, loan loss reserve coverage and the adequacy of the loan loss provision), operating efficiency (noninterest expense compared to total revenue), capital adequacy (Tier-1, total capital and leverage ratios and equity capital growth), leverage (tangible equity as a percentage of tangible assets, short-term and long-term borrowings and double leverage at the holding company) and liquidity (the nature and availability of funding sources, net non-core funding dependence and quality of deposits). In addition, for publicly traded companies, stock price movements were reviewed and the market price of publicly traded debt instruments was examined. The other-than-temporary impairment analysis indicated that the Bancorp’s four pooled trust preferred securities had no additional other-than-temporary impairment for the years ending December 31, 2013 and 2012.
The table below shows the credit loss roll forward for the Bancorp’s pooled trust preferred securities that have been classified with other-than-temporary impairment:
| (Dollars in thousands) | ||||
| Collateralized debt obligations | ||||
| other-than-temporary impairment | ||||
| Ending balance, December 31, 2012 | $ | 271 | ||
| Additions not previously recognized | - | |||
| Ending balance, December 31, 2013 | $ | 271 | ||
| Cusip | 74043CAC1 | 74042TAJ0 | 01449TAB9 | 01450NAC6 | ||||||||||||
| Deal name | PreTSL XXIV | PreTSL XXVII | Alesco IX | Alesco XVII | ||||||||||||
| Class | B-1 | C-1 | A-2A | B | ||||||||||||
| Book value | $ | 1,257 | $ | 1,296 | $ | 1,303 | $ | 1,352 | ||||||||
| Fair value | $ | 421 | $ | 374 | $ | 716 | $ | 457 | ||||||||
| Unrealized gains/(losses) | $ | (836 | ) | $ | (922 | ) | $ | (587 | ) | $ | (895 | ) | ||||
| Lowest credit rating assigned | CC | C | BB | CC | ||||||||||||
| Number of performing banks | 50 | 28 | 53 | 45 | ||||||||||||
| Number of performing insurance companies | 13 | 7 | 10 | n/a | ||||||||||||
| Number of issuers in default | 17 | 9 | 1 | 3 | ||||||||||||
| Number of issuers in deferral | 13 | 5 | 12 | 8 | ||||||||||||
| Defaults & deferrals as a % of performing collateral | 49.14 | % | 33.47 | % | 19.11 | % | 27.59 | % | ||||||||
| Subordination: | ||||||||||||||||
| As a % of performing collateral | -2.11 | % | -10.04 | % | 35.32 | % | 18.23 | % | ||||||||
| As a % of performing collateral - adjusted for projected future defaults. | -11.11 | % | -19.74 | % | 30.75 | % | 13.56 | % | ||||||||
| Other-than-temporary impairment model assumptions: | ||||||||||||||||
| Defaults: | ||||||||||||||||
| Year 1 - issuer average | 2.70 | % | 2.70 | % | 2.20 | % | 1.80 | % | ||||||||
| Year 2 - issuer average | 2.70 | % | 2.70 | % | 2.20 | % | 1.80 | % | ||||||||
| Year 3 - issuer average | 2.70 | % | 2.70 | % | 2.20 | % | 1.80 | % | ||||||||
| > 3 Years - issuer average | (1 | ) | (1 | ) | (1 | ) | (1 | ) | ||||||||
| Discount rate - 3 month Libor, plus implicit yield spread at purchase | 1.48 | % | 1.23 | % | 1.27 | % | 1.44 | % | ||||||||
| Recovery assumptions | (2 | ) | (2 | ) | (2 | ) | (2 | ) | ||||||||
| Prepayments | 0.00 | % | 0.00 | % | 0.00 | % | 0.00 | % | ||||||||
| Other-than-temporary impairment | $ | 41 | $ | 132 | $ | 36 | $ | 62 |
(1) - Default rates > 3 years are evaluated on a issuer by issuer basis and range from 0.25% to 5.00%.
(2) - Recovery assumptions are evaluated on a issuer by issuer basis and range from 0% to 15% with a five year lag.
In the table above, the Bancorp’s subordination for each trust preferred security is calculated by taking the total performing collateral and subtracting the sum of the total collateral within the Bancorp’s class and the total collateral within all senior classes, and then stating this result as a percentage of the total performing collateral. This measure is an indicator of the level of collateral that can default before potential cash flow disruptions may occur. In addition, management calculates subordination assuming future collateral defaults by utilizing the default/deferral assumptions in the Bancorp’s other-than-temporary impairment analysis. Subordination assuming future default/deferral assumptions is calculated by deducting future defaults from the current performing collateral. At December 31, 2013 and 2012, management reviewed the subordination levels for each security in context of the level of current collateral defaults and deferrals within each security; the potential for additional defaults and deferrals within each security; the length of time that the security has been in “payment in kind” status; and the Bancorp’s class position within each security.
| 36 |
Management calculated the other-than-temporary impairment model assumptions based on the specific collateral underlying each individual security. The following assumption methodology was applied consistently to each of the four pooled trust preferred securities: For collateral that has already defaulted, no recovery was assumed; no cash flows were assumed from collateral currently in deferral, with the exception of the recovery assumptions. The default and recovery assumptions were calculated based on the detailed collateral review. The discount rate assumption used in the calculation of the present value of cash flows is based on the discount margin (i.e., credit spread) at the time each security was purchased using the original purchase price. The discount margin is then added to the appropriate 3-month LIBOR forward rate obtained from the forward LIBOR curve.
At December 31, 2013 and 2012, three of the trust preferred securities with a cost basis of $3.9 million have been placed in “payment in kind” status. The Bancorp’s securities that are classified as “payment in kind” are a result of not receiving the scheduled quarterly interest payments. For the securities in “payment in kind” status, management anticipates to receive the unpaid contractual interest payments from the issuer, because of the self correcting cash flow waterfall provisions within the structure of the securities. When a tranche senior to the Bancorp’s position fails the coverage test, the Bancorp’s interest cash flows are paid to the senior tranche and recorded as a reduction of principal. The coverage test represents an over collateralization target by stating the balance of the performing collateral as a percentage of the balance of the Bancorp’s tranche, plus the balance of all senior tranches. The principal reduction in the senior tranche continues until the appropriate coverage test is passed. As a result of the principal reduction in the senior tranche, more cash is available for future payments to the Bancorp’s tranche. Consistent with the Investments – Debt and Equity Securities Topic, management considered the failure of the issuer of the security to make scheduled interest payments in determining whether a credit loss existed. Management will not capitalize the “payment in kind” interest payments to the book value of the securities and will keep these securities in non-accrual status until the quarterly interest payments resume.
| (Dollars in thousands) | ||||||||||||||||
| Estimated Fair Value Measurements at December 31, 2013 Using | ||||||||||||||||
| Assets: | December 31, 2013 | Quoted Prices in Active Markets for Identical Assets (Level 1) | Significant Other Observable Inputs (Level 2) | Significant Unobservable Inputs (Level 3) | ||||||||||||
| Available-for-sale securities | ||||||||||||||||
| U.S. government sponsored entities | $ | 18,360 | $ | - | $ | 18,360 | $ | - | ||||||||
| CMO and residential mortgage-backed securities | 100,315 | - | 100,315 | - | ||||||||||||
| Municipal securities | 73,653 | - | 73,653 | - | ||||||||||||
| Collateralized debt obligations | 1,968 | - | - | 1,968 | ||||||||||||
| Total available-for-sale securities | $ | 194,296 | $ | - | $ | 192,328 | $ | 1,968 | ||||||||
| (Dollars in thousands) | ||||||||||||||||
| Estimated Fair Value Measurements at December 31, 2012 Using | ||||||||||||||||
| Assets: | December
31, 2012 | Quoted
Prices in Active Markets for Identical Assets (Level 1) | Significant Other Observable Inputs (Level 2) | Significant Unobservable Inputs (Level 3) | ||||||||||||
| Available-for-sale securities | ||||||||||||||||
| U.S. government sponsored entities | $ | 23,096 | $ | - | $ | 23,096 | $ | - | ||||||||
| CMO and residential mortgage-backed securities | 99,914 | - | 99,914 | - | ||||||||||||
| Municipal securities | 63,073 | - | 63,073 | - | ||||||||||||
| Collateralized debt obligations | 1,392 | - | - | 1,392 | ||||||||||||
| Total available-for-sale securities | $ | 187,475 | $ | - | $ | 186,083 | $ | 1,392 | ||||||||
Reconciliation of available-for-sale securities, which require significant adjustment based on unobservable data, are presented below:
| (Dollars in thousands) | ||||
| Estimated Fair Value Measurements Using Significant Unobservable Inputs (Level 3) | ||||
| Available-for- sale securities | ||||
| Total realized/unrealized (losses)/gains, January 1, 2012 | $ | 1,361 | ||
| Included in earnings | (6 | ) | ||
| Included in other comprehensive income | 37 | |||
| Transfers in and/or (out) of Level 3 | - | |||
| Ending balance, December 31, 2012 | 1,392 | |||
| Total realized/unrealized (losses)/gains, January 1, 2013 | $ | 1,392 | ||
| Included in earnings | - | |||
| Included in other comprehensive income | 576 | |||
| Transfers in and/or (out) of Level 3 | - | |||
| Ending balance, December 31, 2013 | $ | 1,968 | ||
| 37 |
Assets and Liabilities Measured at Fair Values on a Non-Recurring Basis
Assets and liabilities measured at fair value on a non-recurring basis are summarized below:
| (Dollars in thousands) | ||||||||||||||||
| Estimated Fair Value Measurements at December 31, 2013 | ||||||||||||||||
| December 31, 2013 | Quoted Prices in Active Markets for Identical Assets (Level 1) | Significant Other Observable Inputs (Level 2) | Significant Unobservable Inputs (Level 3) | |||||||||||||
| Impaired loans | $ | 8,164 | $ | - | $ | - | $ | 8,164 | ||||||||
| Foreclosed real estate | 1,084 | - | - | 1,084 | ||||||||||||
| (Dollars in thousands) | ||||||||||||||||
| Estimated Fair Value Measurements at December 31, 2013 | ||||||||||||||||
| December
31, 2012 | Quoted
Prices in Active Markets for Identical Assets (Level 1) | Significant Other Observable Inputs (Level 2) | Significant Unobservable Inputs (Level 3) | |||||||||||||
| Impaired loans | $ | 17,879 | $ | - | $ | - | $ | 17,879 | ||||||||
| Foreclosed real estate | 425 | - | - | 425 | ||||||||||||
The fair value of impaired loans with specific allocations of the allowance for loan losses or loans for which charge-offs have been taken is generally based on the present value of future cash flows or, for collateral dependent loans, based on recent real estate appraisals. Appraisals may utilize a single valuation approach or a combination of approaches, including comparable sales and the income approach. The unpaid principal balance of impaired loans was approximately $9.9 million and the related specific reserves totaled approximately $1.7 million, resulting in a fair value of impaired loans totaling approximately $8.2 million, at December 31, 2013. The unpaid principal balance of impaired loans was approximately $19.9 million and the related specific reserves totaled approximately $2.0 million, resulting in a fair value of impaired loans totaling approximately $17.9 million, at December 31, 2012. Fair value is determined, where possible, using market prices derived from an appraisal or evaluation, which are considered to be Level 2 inputs. However, certain assumptions and unobservable inputs are often used by the appraiser, therefore, qualifying the assets as Level 3 in the fair value hierarchy. The fair value of foreclosed real estate is similarly determined by using the results of recent real estate appraisals. The numerical range of unobservable inputs for these valuation assumptions is not meaningful.
| 38 |
The following table shows carrying values and related estimated fair values of financial instruments as of the dates indicated. Estimated fair values are further categorized by the inputs used to measure fair value. Items that are not financial instruments are not included.
| (Dollars in thousands) | ||||||||||||||||||||
| December 31, 2013 | Estimated Fair Value Measurements at December 31, 2013 Using | |||||||||||||||||||
| Carrying Value | Estimated Fair Value | Quoted Prices in Active Markets for Identical Assets (Level 1) | Significant Other Observable Inputs (Level 2) | Significant Unobservable Inputs (Level 3) | ||||||||||||||||
| Financial assets: | ||||||||||||||||||||
| Cash and cash equivalents | $ | 21,124 | $ | 21,124 | $ | 21,124 | $ | - | $ | - | ||||||||||
| Securities available-for-sale | 194,296 | 194,296 | - | 192,328 | 1,968 | |||||||||||||||
| Loans held-for-sale | 136 | 138 | 138 | - | - | |||||||||||||||
| Loans receivable, net | 430,632 | 427,719 | - | - | 427,719 | |||||||||||||||
| Federal Home Loan Bank stock | 3,086 | 3,086 | - | 3,086 | - | |||||||||||||||
| Accrued interest receivable | 2,480 | 2,480 | - | 2,480 | - | |||||||||||||||
| Financial liabilities: | ||||||||||||||||||||
| Non-interest bearing deposits | 73,430 | 73,430 | 73,430 | - | - | |||||||||||||||
| Interest bearing deposits | 499,463 | 499,470 | 343,847 | 155,623 | - | |||||||||||||||
| Repurchase agreements | 14,031 | 14,043 | 8,042 | 6,001 | - | |||||||||||||||
| Borrowed funds | 30,898 | 30,956 | 799 | 30,157 | - | |||||||||||||||
| Accrued interest payable | 47 | 47 | - | 47 | - | |||||||||||||||
| (Dollars in thousands) | ||||||||||||||||||||
| December 31, 2012 | Estimated Fair Value Measurements at December 31, 2012 Using | |||||||||||||||||||
| Carrying Value | Estimated Fair Value | Quoted Prices in Active Markets for Identical Assets (Level 1) | Significant Other Observable Inputs (Level 2) | Significant Unobservable Inputs (Level 3) | ||||||||||||||||
| Financial assets: | ||||||||||||||||||||
| Cash and cash equivalents | $ | 33,751 | $ | 33,751 | $ | 33,751 | $ | - | $ | - | ||||||||||
| Securities available-for-sale | 187,475 | 187,475 | - | 186,083 | 1,392 | |||||||||||||||
| Loans held-for-sale | 323 | 332 | 332 | - | - | |||||||||||||||
| Loans receivable, net | 428,560 | 429,733 | - | - | 429,733 | |||||||||||||||
| Federal Home Loan Bank stock | 3,086 | 3,086 | - | 3,086 | - | |||||||||||||||
| Accrued interest receivable | 2,483 | 2,483 | - | 2,483 | - | |||||||||||||||
| Financial liabilities: | ||||||||||||||||||||
| Non-interest bearing deposits | 75,228 | 75,228 | 75,228 | - | - | |||||||||||||||
| Interest bearing deposits | 491,181 | 491,295 | 319,520 | 171,775 | - | |||||||||||||||
| Repurchase agreements | 16,298 | 16,310 | 10,131 | 6,179 | - | |||||||||||||||
| Borrowed funds | 33,207 | 33,658 | 207 | 33,451 | - | |||||||||||||||
| Accrued interest payable | 52 | 52 | - | 52 | - | |||||||||||||||
The following methods were used to estimate the fair value of financial instruments presented in the preceding table for the periods ended December 31, 2013 and 2012:
Cash and cash equivalent carrying amounts approximate fair value. The fair values of securities available-for-sale are obtained from broker pricing (Level 2), with the exception of collateralized debt obligations, which are valued by a third-party specialist (Level 3). Loans held-for-sale comprise residential mortgages and are priced based on values established by the secondary mortgage markets (Level 1). The estimated fair value for net loans receivable is based on estimates of the rate the Bancorp would charge for similar such loans, applied for the time period until estimated repayment, in addition to appraisals which may utilize a single valuation approach or a combination of approaches including comparable sales and the income approach (Level 3). Federal Home Loan Bank stock is estimated at book value due to restrictions that limit the sale or transfer of the security. Fair value of accrued interest receivable and payable approximates book value, as the carrying values are determined using the observable interest rate, balance, and last payment date.
| 39 |
Non-interest and interest bearing deposits, which include checking, savings, and money market deposits, are estimated to have fair values based on the amount payable as of the reporting date (Level 1). The fair value of fixed-maturity certificates of deposit (included in interest bearing deposits) are based on estimates of the rate the Bancorp would pay on similar deposits, applied for the time period until maturity (Level 2). Estimated fair values for short-term repurchase agreements, which represent sweeps from demand deposits to accounts secured by pledged securities, are estimated based on the amount payable as of the reporting date (Level 1). Longer-term repurchase agreements, with contractual maturity dates of three months or more, are based on estimates of the rate the Bancorp would pay on similar deposits, applied for the time period until maturity (Level 2). Short-term borrowings are generally only held overnight, therefore, their carrying amount is a reasonable estimate of fair value (Level 1). The fair value of FHLB Advances are estimated by discounting the future cash flows using quoted rates from the FHLB similar advances with similar maturities (Level 2). The estimated fair value of other financial instruments, and off-balance sheet loan commitments, approximate cost and are not considered significant to this presentation.
Note 16 – Parent Company Only Statements
| (Dollars in thousands) | ||||||||
| NorthWest Indiana Bancorp | ||||||||
| Condensed Balance Sheets | ||||||||
| December 31, | ||||||||
| 2013 | 2012 | |||||||
| Assets | ||||||||
| Cash on deposit with Peoples Bank | $ | 142 | $ | 1 | ||||
| Investment in Peoples Bank | 66,301 | 67,321 | ||||||
| Dividends receivable from Peoples Bank | 626 | 539 | ||||||
| Other assets | 597 | 405 | ||||||
| Total assets | $ | 67,666 | $ | 68,266 | ||||
| Liabilities and stockholders’ equity | ||||||||
| Dividends payable | $ | 625 | $ | 539 | ||||
| Other liabilities | 279 | 76 | ||||||
| Total liabilities | 904 | 615 | ||||||
| Common stock | 361 | 361 | ||||||
| Additional paid in capital | 5,230 | 5,189 | ||||||
| Accumulated other comprehensive income | (3,151 | ) | 2,339 | |||||
| Retained earnings | 65,519 | 60,817 | ||||||
| Treasury stock | (1,197 | ) | (1,055 | ) | ||||
| Total stockholders’ equity | 66,762 | 67,651 | ||||||
| Total liabilities and stockholders’ equity | $ | 67,666 | $ | 68,266 | ||||
| (Dollars in thousands) | ||||||||
| NorthWest Indiana Bancorp | ||||||||
| Condensed Statements of Income | ||||||||
| Year Ended December 31, | ||||||||
| 2013 | 2012 | |||||||
| Dividends from Peoples Bank | $ | 2,741 | $ | 2,044 | ||||
| Operating expenses | 138 | 162 | ||||||
| Income before income taxes and equity in undistributed income of Peoples Bank | 2,603 | 1,882 | ||||||
| Income tax benefit | (45 | ) | (52 | ) | ||||
| Income before equity in undistributed income of Peoples Bank | 2,648 | 1,934 | ||||||
| Equity in undistributed income of Peoples Bank | 4,470 | 4,919 | ||||||
| Net income | $ | 7,118 | $ | 6,853 | ||||
| (Dollars in thousands) | ||||||||
| NorthWest Indiana Bancorp | ||||||||
| Condensed Statements of Cash Flows | ||||||||
| Year Ended December 31, | ||||||||
| 2013 | 2012 | |||||||
| Cash flows from operating activities: | ||||||||
| Net income | $ | 7,118 | $ | 6,853 | ||||
| Adjustments to reconcile net income to net cash provided by operating activities | ||||||||
| Equity in undistributed net income of Peoples Bank | (4,979 | ) | (5,071 | ) | ||||
| Deferred tax expense/(benefit) | 509 | 152 | ||||||
| Stock based compensation expense | 40 | 16 | ||||||
| Change in other assets | (279 | ) | (392 | ) | ||||
| Change in other liabilities | 203 | (883 | ) | |||||
| Total adjustments | (4,506 | ) | (6,178 | ) | ||||
| Net cash - operating activities | 2,612 | 675 | ||||||
| Cash flows from investing activities | - | - | ||||||
| Cash flows from financing activities: | ||||||||
| Dividends paid | (2,328 | ) | (1,928 | ) | ||||
| Treasury stock purchased | (173 | ) | (78 | ) | ||||
| Proceeds from sale of treasury stock | 30 | 141 | ||||||
| Net cash - financing activities | (2,471 | ) | (1,865 | ) | ||||
| Net change in cash | 141 | (1,190 | ) | |||||
| Cash at beginning of year | 1 | 1,191 | ||||||
| Cash at end of year | $ | 142 | $ | 1 | ||||
| 40 |
Market Information
The Bancorp’s Common Stock is traded in the over-the-counter market and quoted on the OTC Bulletin Board. The Bancorp’s stock is not actively traded. As of January 31, 2014, the Bancorp had 2,841,164 shares of common stock outstanding and 407 stockholders of record. This does not reflect the number of persons or entities who may hold their stock in nominee or “street” name through brokerage firms. Set forth below are the high and low bid prices during each quarter for the years ended December 31, 2013 and December 31, 2012. The bid prices reflect inter-dealer prices without retail mark-up, mark-down or commission and may not necessarily represent actual transactions. Also set forth is information concerning the dividends declared by the Bancorp during the periods reported. Note 10 to the Financial Statements describes regulatory limits on the Bancorp’s ability to pay dividends.
| Dividends | ||||||||||||||
| Per Share Prices | Declared Per | |||||||||||||
| High | Low | Common Share | ||||||||||||
| Year Ended December 31, 2013 | 1st Quarter | $ | 25.30 | $ | 19.10 | $ | 0.19 | |||||||
| 2nd Quarter | 25.00 | 22.00 | 0.22 | |||||||||||
| 3rd Quarter | 25.00 | 23.00 | 0.22 | |||||||||||
| 4th Quarter | 25.20 | 23.25 | 0.22 | |||||||||||
| Year Ended December 31, 2012 | 1st Quarter | $ | 20.00 | $ | 13.25 | $ | 0.15 | |||||||
| 2nd Quarter | 20.00 | 18.30 | 0.19 | |||||||||||
| 3rd Quarter | 19.25 | 18.50 | 0.19 | |||||||||||
| 4th Quarter | 21.00 | 17.58 | 0.19 | |||||||||||


| 41 |
2013 Board of Directors
David A. Bochnowski, Director since 1977
Chairman, President and Chief Executive Officer of the Bancorp
Stanley E. Mize, Director since 1997
Retired; former President of Stan Mize Towne & Country Auto Sales, Inc.
Frank J. Bochnowski, Director since 1999
Retired; former Executive Vice President and Secretary of the Bancorp
James L. Wieser, Director since 1999
Attorney and Senior Partner, Wieser & Wyllie, LLP
Edward J. Furticella, Director since 2000
Former Executive Vice President and CFO of the Bancorp; currently Professor, Department
Head of the Accounting Program and Director of the Masters of Accountancy Program
at Purdue University Calumet
Danette Garza, Director since 2013
Attorney At Law, Certified Public Accountant,
Owner of Continental Languages, LLC
Joel Gorelick, Director since 2000
Retired; former President and Chief Operating Officer of the Bancorp
Kenneth V. Krupinski, Director since 2003
Certified Public Accountant, Swartz Retson, P.C.
Anthony M. Puntillo, D.D.S., M.S.D., Director since 2004
Orthodontist, CEO of Puntillo and Crane Orthodontics, P.C.
Donald P. Fesko, Director since 2005
Chief Executive Officer, Community Hospital
Amy W. Han, Ph.D., Director since 2008
Indiana University School of Medicine – Northwest
Leroy F. Cataldi, P.D., Director Emeritus
Lourdes M. Dennison, Director Emeritus
Gloria C. Gray-Weissman, Director Emeritus
2013 Board Committees
Compensation and Benefits
Kenneth V. Krupinski, Chairman
Donald P. Fesko
Amy W. Han
Stanley E. Mize
Executive Committee
David A. Bochnowski, Chairman
Frank J. Bochnowski
Edward J. Furticella
Stanley E. Mize
James L. Wieser
Nominating and Corporate Governance
Frank J. Bochnowski, Chairman
Donald P. Fesko
Edward J. Furticella
Danette Garza
Amy W. Han
Kenneth V. Krupinski
Stanley E. Mize
Anthony M. Puntillo
James L. Wieser
Risk Management
Edward J. Furticella, Chairman
Danette Garza
Kenneth V. Krupinski
Stanley E. Mize
Anthony M. Puntillo
Strategic Planning
James L. Wieser, Chairman
Frank J. Bochnowski
Edward J. Furticella
Danette Garza
Kenneth V. Krupinski
Stanley E. Mize
Anthony M. Puntillo
Wealth Management
Donald P. Fesko, Chairman
Joel Gorelick
Amy W. Han

