Exhibit 99.1.
2017 Annual Shareholders’ Meeting 27 - April - 2017
Forward Looking Statements 27 - April - 2017 “Forward - looking statements” as defined in the Private Securities Litigation Reform Act of 1995 may be included in this release. A variety of factors could cause the Bancorp’s actual results to differ from those expected at the time of this release. These include, but are not limited to, changes in economic conditions in the Bancorp’s market area, changes in policies by regulatory agencies, fluctuation in interest rates, demand for loans in the Bancorp’s market area, economic conditions in the financial services industry, the Bancorp’s ability to successfully integrate the operations of recently acquired institutions, competition and other risks set forth in the Bancorp’s reports filed with the Securities and Exchange Commission, including its Annual Report on Form 10 - K for the year ended December 31, 2016. Readers are urged to carefully review and consider the various disclosures made by the Bancorp in its periodic reports filed with the Securities and Exchange Commission. Forward - looking statements speak only as of the date they are made, and the Bancorp undertakes no obligation to update them in light of new information or future events.
SUSTAINED PERFORMANCE 27 - April - 2017
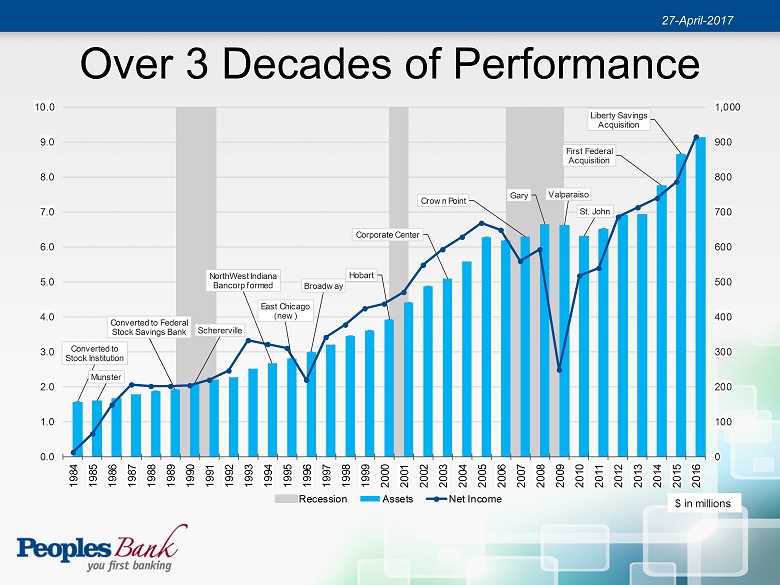
Over 3 Decades of Performance 27 - April - 2017 Converted to Stock Institution Munster Converted to Federal Stock Savings Bank Schererville NorthWest Indiana Bancorp formed East Chicago (new) Broadway Hobart Corporate Center Crown Point Gary Valparaiso St. John First Federal Acquisition Liberty Savings Acquisition 0 100 200 300 400 500 600 700 800 900 1,000 0.0 1.0 2.0 3.0 4.0 5.0 6.0 7.0 8.0 9.0 10.0 1984 1985 1986 1987 1988 1989 1990 1991 1992 1993 1994 1995 1996 1997 1998 1999 2000 2001 2002 2003 2004 2005 2006 2007 2008 2009 2010 2011 2012 2013 2014 2015 2016 Recession Assets Net Income $ in millions
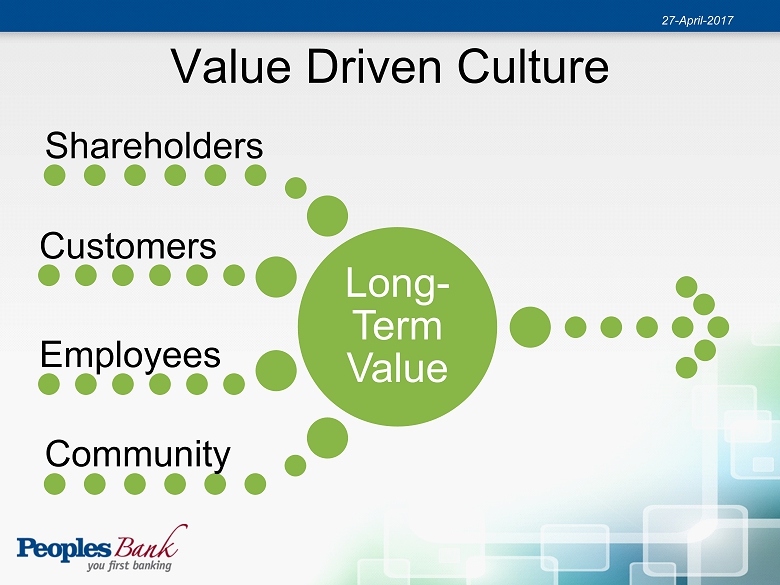
Value Driven Culture 27 - April - 2017 Long - Term Value Shareholders Customers Employees Community
2016 PERFORMANCE SUMMARY 27 - April - 2017
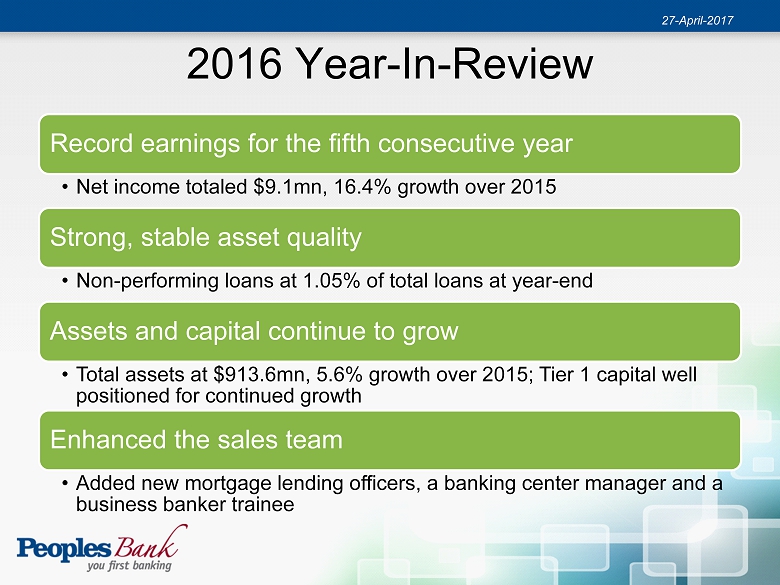
2016 Year - In - Review Record earnings for the fifth consecutive year • Net income totaled $9.1mn, 16.4% growth over 2015 Strong, stable asset quality • Non - performing loans at 1.05% of total loans at year - end Assets and capital continue to grow • Total assets at $913.6mn, 5.6% growth over 2015; Tier 1 capital well positioned for continued growth Enhanced the sales team • Added new mortgage lending officers, a banking center manager and a business banker trainee 27 - April - 2017
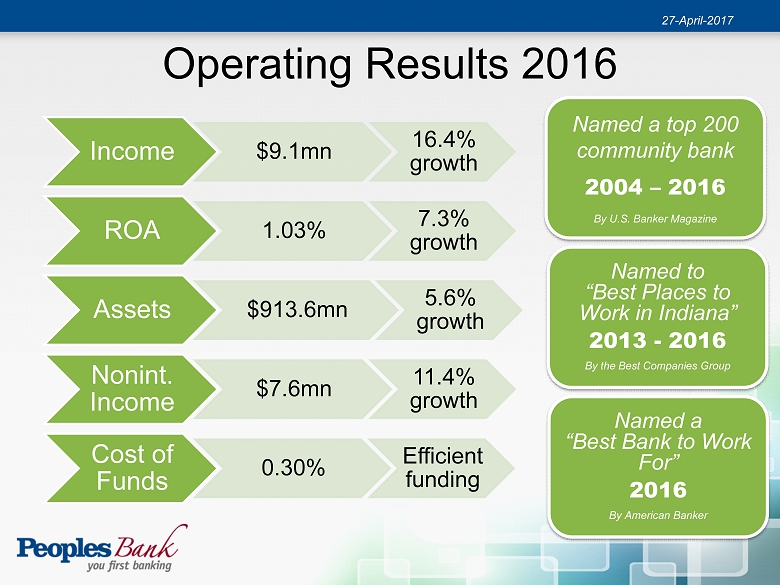
Operating Results 2016 Income $9.1mn 16.4% growth ROA 1.03% 7.3% growth Assets $913.6mn 5.6% growth Nonint. Income $7.6mn 11.4% growth Cost of Funds 0.30% Efficient funding 27 - April - 2017 Named to “Best Places to Work in Indiana” 2013 - 2016 By the Best Companies Group Named a top 200 community bank 2004 – 2016 By U.S. Banker Magazine Named a “Best Bank to Work F or” 2016 By American Banker
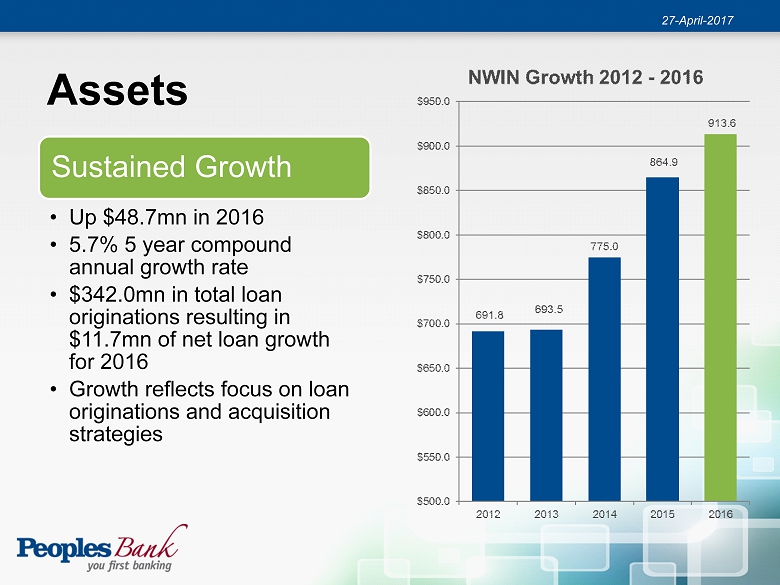
Assets 27 - April - 2017 Sustained Growth • Up $48.7mn in 2016 • 5.7% 5 year compound annual growth rate • $342.0mn in total loan originations resulting in $11.7mn of net loan growth for 2016 • Growth reflects focus on loan originations and acquisition strategies
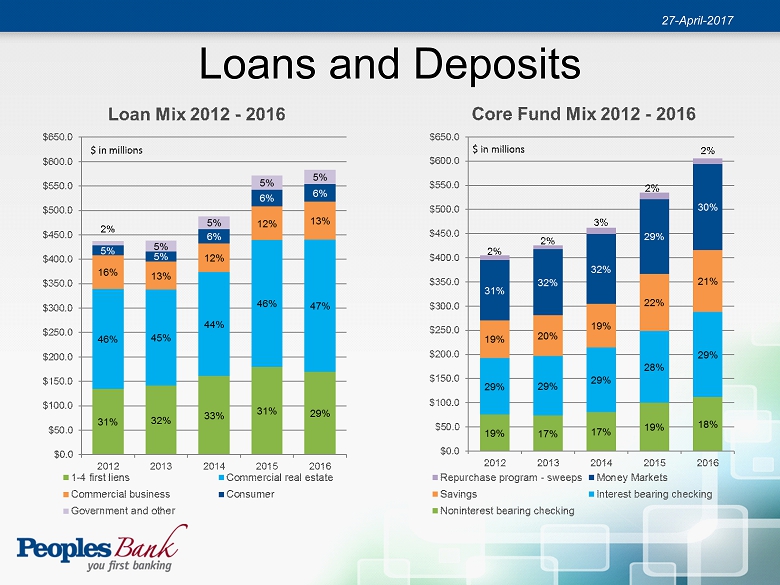
Loans and Deposits 27 - April - 2017
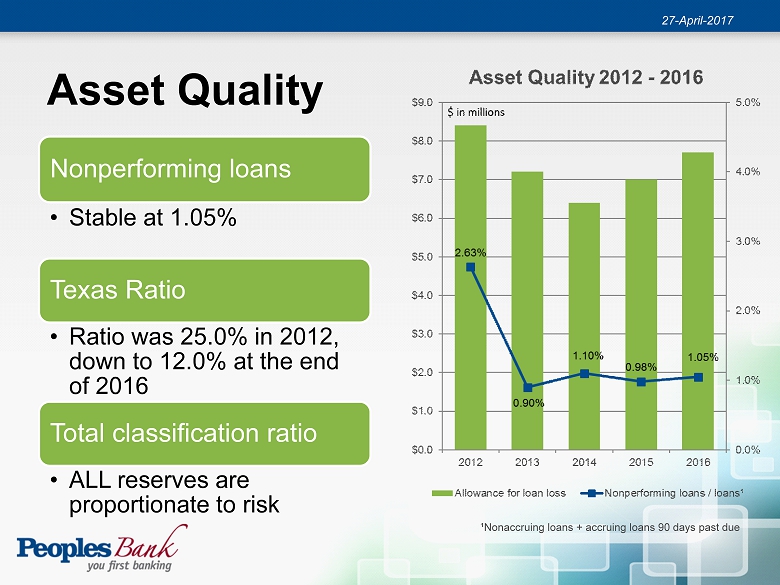
Asset Quality 27 - April - 2017 Nonperforming loans • Stable at 1.05% Texas Ratio • Ratio was 25.0% in 2012, down to 12.0% at the end of 2016 Total classification ratio • ALL reserves are proportionate to risk ¹Nonaccruing loans + accruing loans 90 days past due
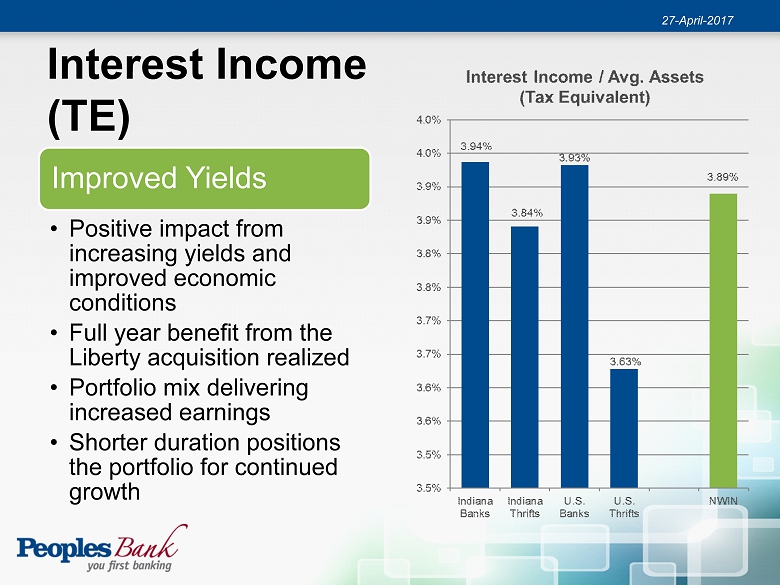
Interest Income (TE) 27 - April - 2017 Improved Yields • Positive impact from increasing yields and improved economic conditions • Full year benefit from the Liberty acquisition realized • Portfolio mix delivering increased earnings • Shorter duration positions the portfolio for continued growth
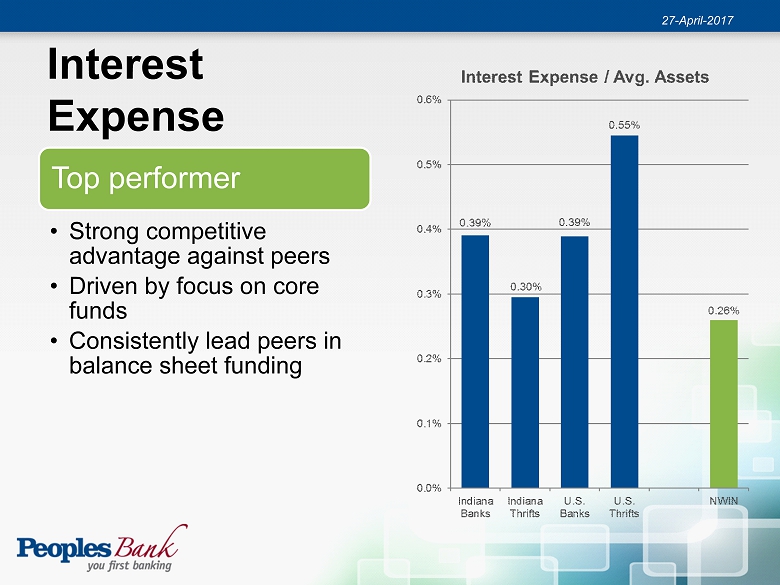
Interest Expense 27 - April - 2017 Top performer • Strong competitive advantage against peers • Driven by focus on core funds • Consistently lead peers in balance sheet funding
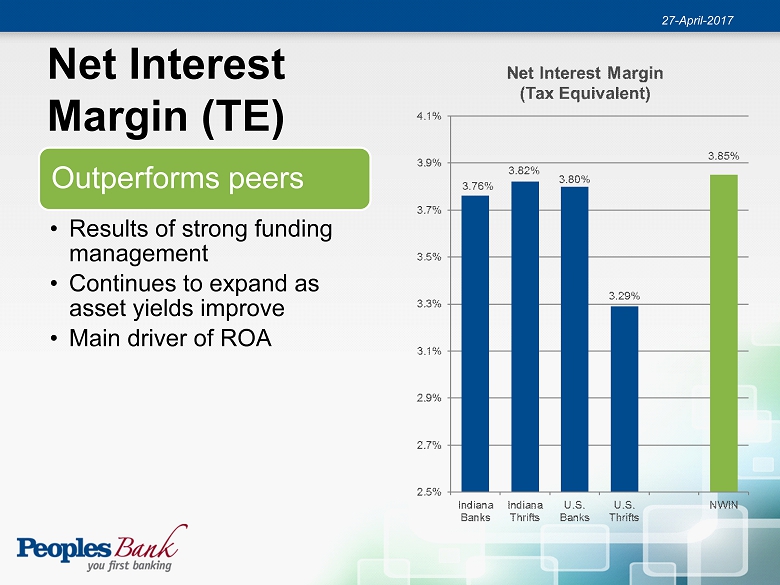
Net Interest Margin (TE) 27 - April - 2017 Outperforms peers • Results of strong funding management • Continues to expand as asset yields improve • Main driver of ROA
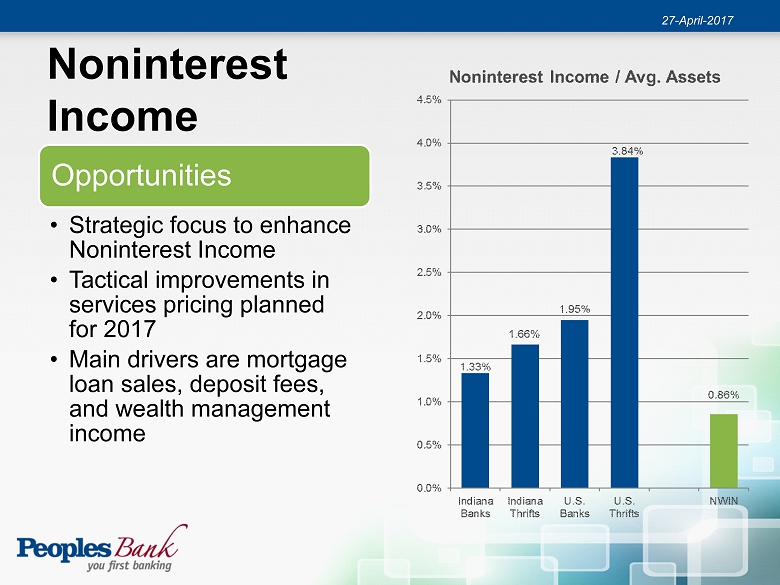
Noninterest Income 27 - April - 2017 Opportunities • Strategic focus to enhance Noninterest Income • Tactical improvements in services pricing planned for 2017 • Main drivers are mortgage loan sales, deposit fees, and wealth management income
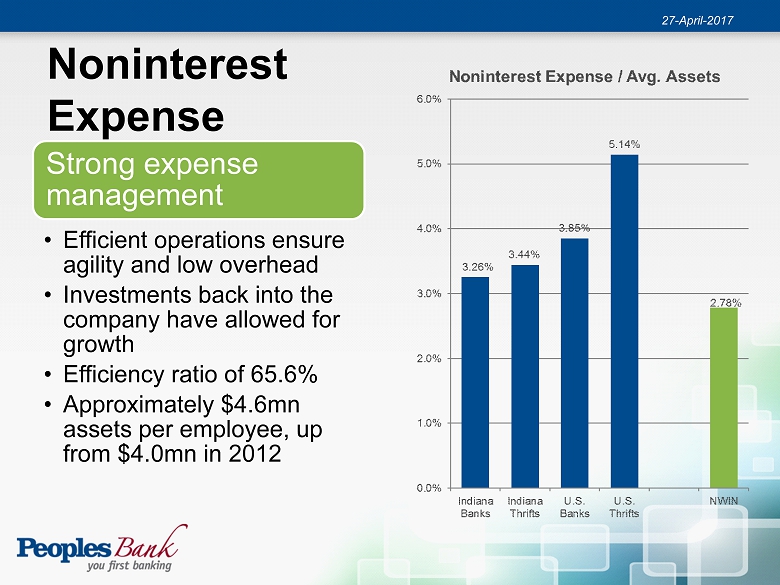
Noninterest Expense 27 - April - 2017 Strong expense management • Efficient operations ensure agility and low overhead • Investments back into the company have allowed for growth • Efficiency ratio of 65.6% • Approximately $4.6mn assets per employee, up from $4.0mn in 2012
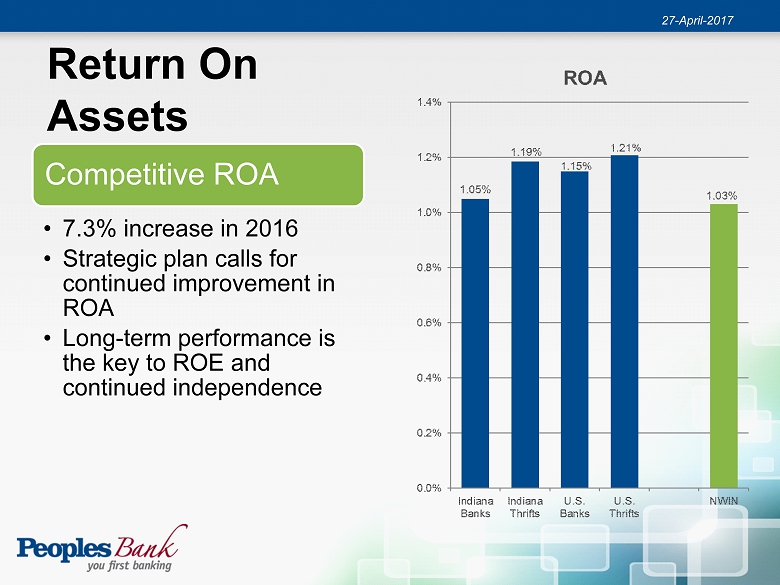
Return On Assets 27 - April - 2017 Competitive ROA • 7.3% increase in 2016 • Strategic plan calls for continued improvement in ROA • Long - term performance is the key to ROE and continued independence
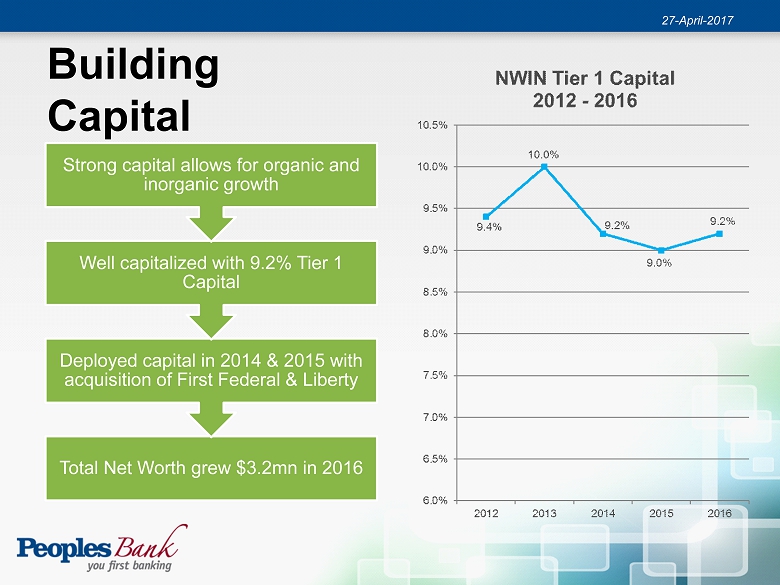
Building Capital 27 - April - 2017 Total Net Worth grew $3.2mn in 2016 Deployed capital in 2014 & 2015 with acquisition of First Federal & Liberty Well capitalized with 9.2% Tier 1 Capital Strong capital allows for organic and inorganic growth
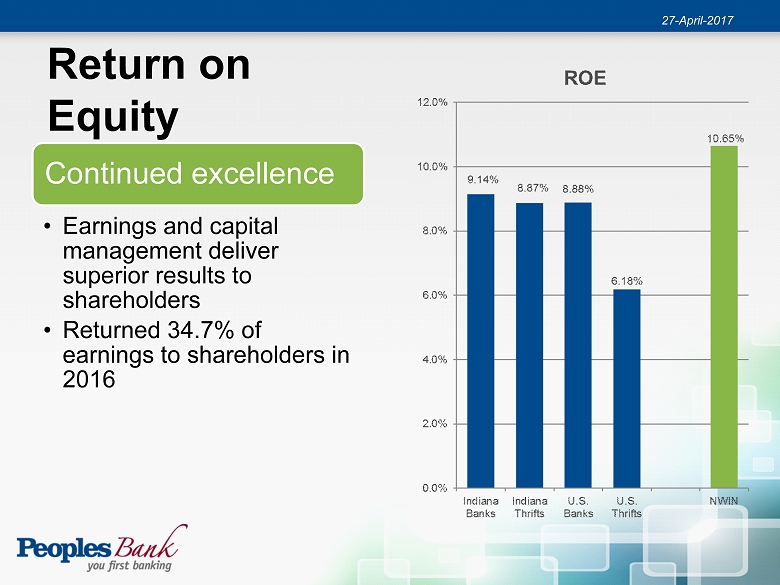
Return on Equity 27 - April - 2017 Continued excellence • Earnings and capital management deliver superior results to shareholders • Returned 34.7% of earnings to shareholders in 2016
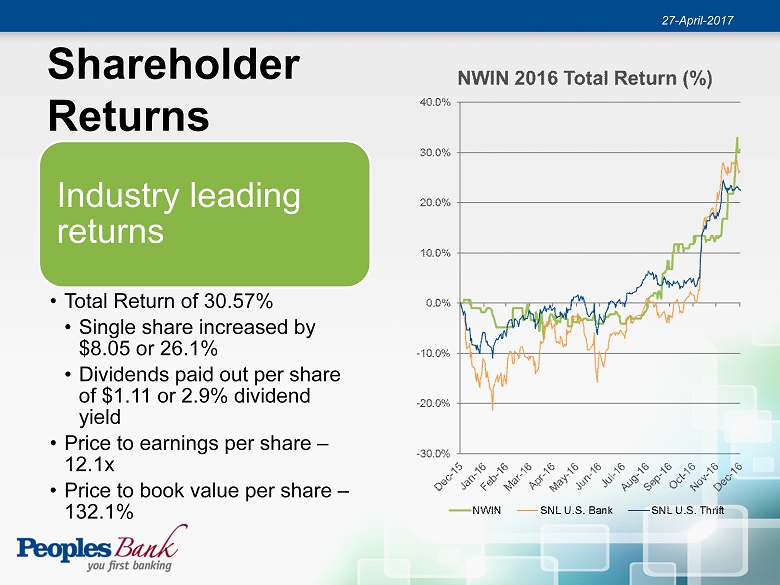
Shareholder Returns 27 - April - 2017 Industry leading returns • Total Return of 30.57% • Single share increased by $8.05 or 26.1% • Dividends paid out per share of $1.11 or 2.9% dividend yield • Price to earnings per share – 12.1x • Price to book value per share – 132.1%
WHAT’S AHEAD 2017 27 - April - 2017
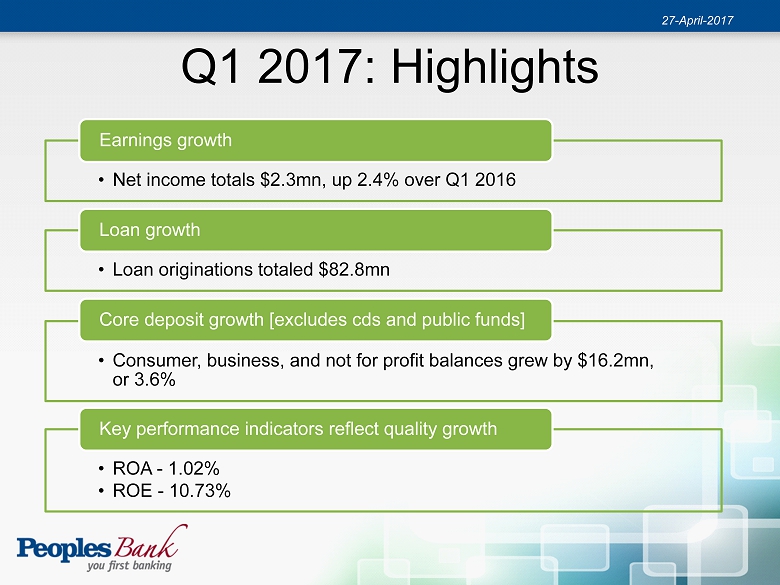
Q1 2017: Highlights • Net income totals $2.3mn, up 2.4% over Q1 2016 Earnings growth • Loan originations totaled $82.8mn Loan growth • Consumer, business, and not for profit balances grew by $16.2mn, or 3.6% Core deposit growth [excludes cds and public funds] • ROA - 1.02% • ROE - 10.73% Key performance indicators reflect quality growth 27 - April - 2017
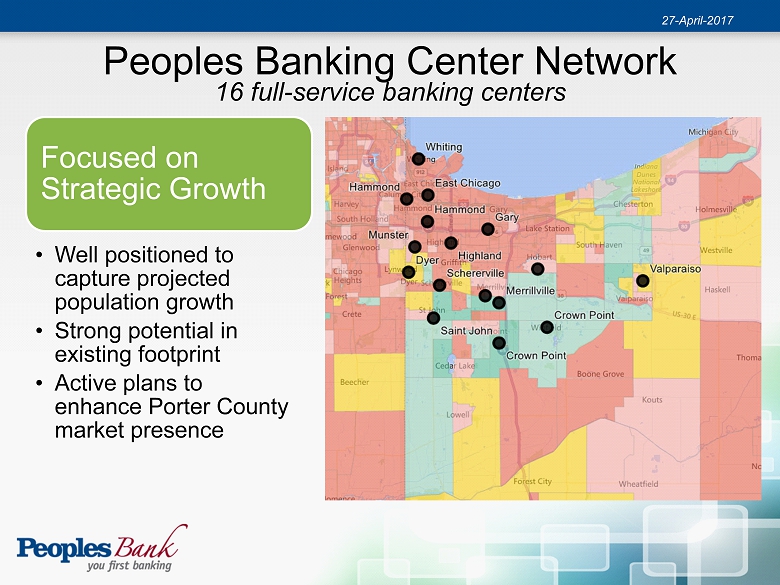
Peoples Banking Center Network 27 - April - 2017 16 full - service banking centers Focused on Strategic Growth • Well positioned to capture projected population growth • Strong potential in existing footprint • Active plans to enhance Porter County market presence
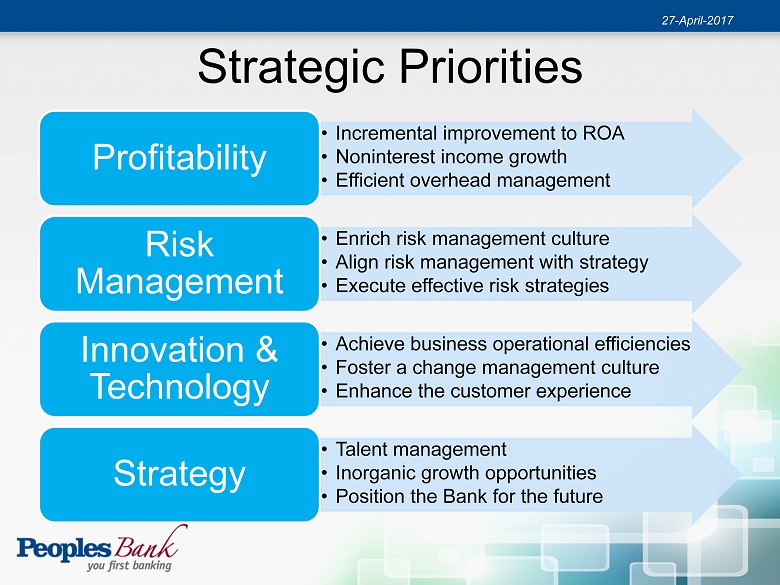
Strategic Priorities • Incremental improvement to ROA • Noninterest income growth • Efficient overhead management Profitability • Enrich risk management culture • Align risk management with strategy • Execute effective risk strategies Risk Management • Achieve business operational efficiencies • Foster a change management culture • Enhance the customer experience Innovation & Technology • Talent management • Inorganic growth opportunities • Position the Bank for the future Strategy 27 - April - 2017
Thank you. 27 - April - 2017