2018 Annual Shareholders’ Meeting 27 - April - 2018 Filed by NorthWest Indiana Bancorp pursuant to Rule 425 under the Securities Act of 1933 and deemed filed Pursuant to Rule 14a - 12 of the Securities Exchange Act of 1934 Subject Company: NorthWest Indiana Bancorp Commission File No. 000 - 26128 Exhibit 99.1
Forward - Looking Statements This presentation may contain forward - looking statements regarding the financial performance, business prospects, growth and operating strategies of NorthWest Indiana Bancorp (“NWIN”), as well as those of First Personal Financial Corp. (“First Personal”), with which NWIN has entered into a previously announced Agreement and Plan of Merger dated February 20, 2018, providing for the proposed merger of First Personal with and into NWIN. For these statements, each of NWIN and First Personal claims the protections of the safe harbor for forward - looking statements contained in the Private Securities Litigation Reform Act of 1995. Statements in this communication should be considered in conjunction with the other information available about NWIN and First Personal, including the information in the filings NWIN makes with the SEC, including its Annual Report on Form 10 - K for the year ended December 31, 2017. Forward - looking statements provide current expectations or forecasts of future events and are not guarantees of future performance. The forward - looking statements are based on management’s expectations and are subject to a number of risks and uncertainties. Forward - looking statements are typically identified by using words such as “anticipate,” “estimate,” “project,” “intend,” “plan,” “believe,” “will” and similar expressions in connection with any discussion of future operating or financial performance. Although management believes that the expectations reflected in such forward - looking statements are reasonable, actual results may differ materially from those expressed or implied in such statements. Risks and uncertainties that could cause actual results to differ materially include: ability to obtain regulatory approvals and meet other closing conditions to the merger, including approval by First Personal’s shareholders; delay in closing the merger; difficulties and delays in integrating NWIN’s and First Personal’s businesses or fully realizing cost savings and other benefits; business disruption following the merger; changes in asset quality and credit risk; the inability to sustain revenue and earnings growth; changes in interest rates and capital markets; inflation; customer acceptance of NWIN’s and First Personal’s products and services; customer borrowing, repayment, investment, and deposit practices; customer disintermediation; the introduction, withdrawal, success, and timing of business initiatives; competitive conditions; the inability to realize cost savings or revenues or to implement integration plans and other consequences associated with mergers, acquisitions, and divestitures; economic conditions; and the impact, extent, and timing of technological changes, capital management activities, and other actions of the Federal Reserve Board and legislative and regulatory actions and reforms. 27 - April - 2018 2
Additional Information For Shareholders In connection with the proposed merger, NorthWest Indiana Bancorp (“NWIN”) will file with the SEC a Registration Statement on Form S - 4 that will include a Proxy Statement of First Personal Financial and a Prospectus of NWIN (the “proxy statement/prospectus”) as well as other relevant documents concerning the proposed transaction. SHAREHOLDERS AND INVESTORS ARE URGED TO READ THE REGISTRATION STATEMENT AND THE PROXY STATEMENT/PROSPECTUS REGARDING THE MERGER WHEN IT BECOMES AVAILABLE AND ANY OTHER RELEVENT DOCUMENTS FILED WITH THE SEC, AS WELL AS ANY AMENDMENTS OR SUPPLEMENTS TO THOSE DOCUMENTS, BECAUSE THEY WILL CONTAIN IMPORTANT INFORMATION. The proxy statement/prospectus and other relevant materials (when they become available) and any other documents NWIN has filed with the SEC, may be obtained free of charge at the SEC’s website at www.sec.gov. In addition, investors and security holders may obtain free copies of the documents NWIN has filed with the SEC from NWIN at www.ibankpeoples.com in the link for “Investor Relations – SEC Filings - Documents.” Alternatively, these documents, when available, can be obtained free of charge from NWIN upon written request to NorthWest Indiana Bancorp, Attn: Corporate Secretary, 9204 Columbia Avenue, Munster, Indiana 46321. The information available through NWIN’s website is not and shall not be deemed part of this presentation or incorporated by reference into other filings NWIN makes with the SEC. This communication does not constitute an offer to sell or the solicitation of an offer to buy any securities or a solicitation of any vote or approval. NWIN and First Personal and certain of their respective directors and executive officers may be deemed to be participants in the solicitation of proxies from the shareholders of First Personal in connection with the proposed merger. Information about the directors and executive officers of NWIN is set forth in NWIN’s Annual Report on Form 10 - K filed with the SEC on February 20, 2018, and in the proxy statement for NWIN’s 2018 annual meeting of shareholders, as filed with the SEC on March 12, 2018. Additional information regarding the interests of these participants in the transaction may be obtained by reading the proxy statement/prospectus regarding the proposed merger when it becomes available. Free copies of this document may be obtained as described in the preceding paragraph. 27 - April - 2018 3
Disclosures Regarding Non - GAAP Measures This presentation refers to certain financial measures that are identified as non - GAAP. The Bancorp believes that these non - GAAP measures are helpful to investors to better understand the Bancorp’s [assets, earnings, and shareholders’ equity] at the date of this presentation. This supplemental information should not be considered in isolation or as a substitute for the related GAAP measures. See the attached table at the end of this presentation for a reconciliation of the non - GAAP measures identified herein and their most comparable GAAP measures. 27 - April - 2018 4
SUSTAINED PERFORMANCE 27 - April - 2018 5
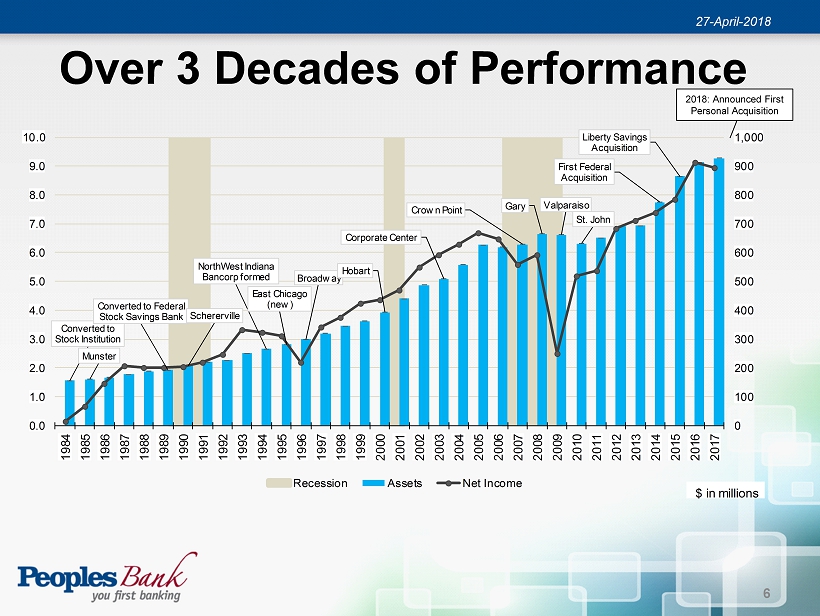
Over 3 Decades of Performance Converted to Stock Institution Munster Converted to Federal Stock Savings Bank Schererville NorthWest Indiana Bancorp formed East Chicago (new) Broadway Hobart Corporate Center Crown Point Gary Valparaiso St. John First Federal Acquisition Liberty Savings Acquisition 0 100 200 300 400 500 600 700 800 900 1,000 0.0 1.0 2.0 3.0 4.0 5.0 6.0 7.0 8.0 9.0 10.0 1984 1985 1986 1987 1988 1989 1990 1991 1992 1993 1994 1995 1996 1997 1998 1999 2000 2001 2002 2003 2004 2005 2006 2007 2008 2009 2010 2011 2012 2013 2014 2015 2016 2017 Recession Assets Net Income $ in millions 27 - April - 2018 2018: Announced First Personal Acquisition 6
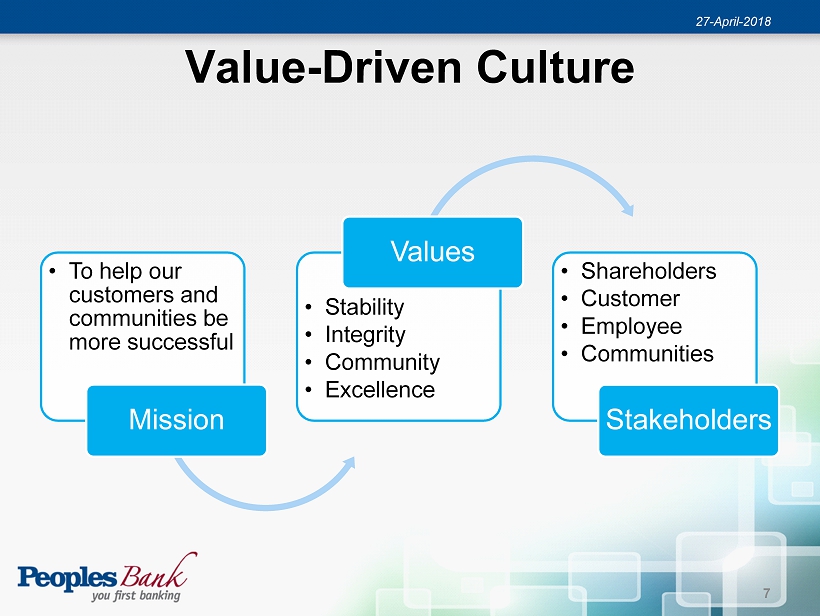
Value - Driven Culture • To help our customers and communities be more successful Mission • Stability • Integrity • Community • Excellence Values • Shareholders • Customer • Employee • Communities Stakeholders 27 - April - 2018 7
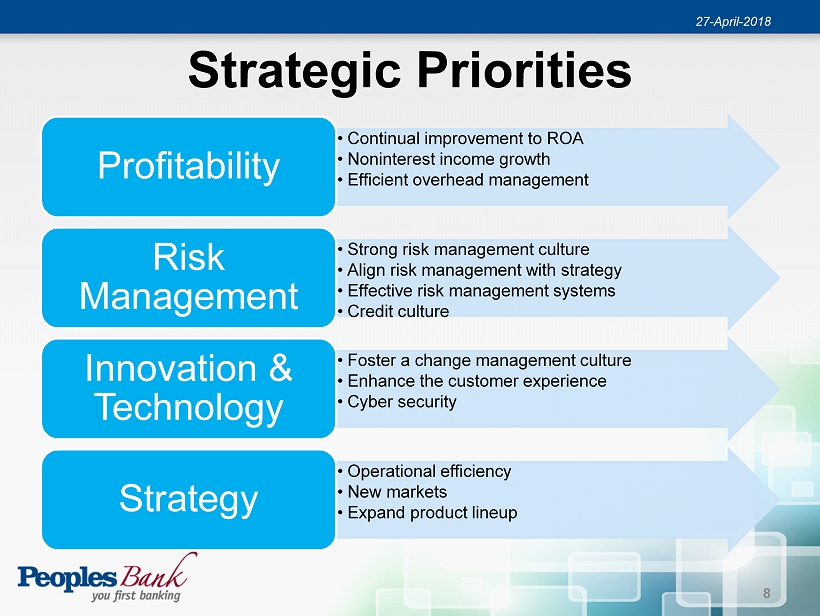
Strategic Priorities • Continual improvement to ROA • Noninterest income growth • Efficient overhead management Profitability • Strong risk management culture • Align risk management with strategy • Effective risk management systems • Credit culture Risk Management • Foster a change management culture • Enhance the customer experience • Cyber security Innovation & Technology • Operational efficiency • New markets • Expand product lineup Strategy 27 - April - 2018 8
2017 PERFORMANCE SUMMARY 27 - April - 2018 9
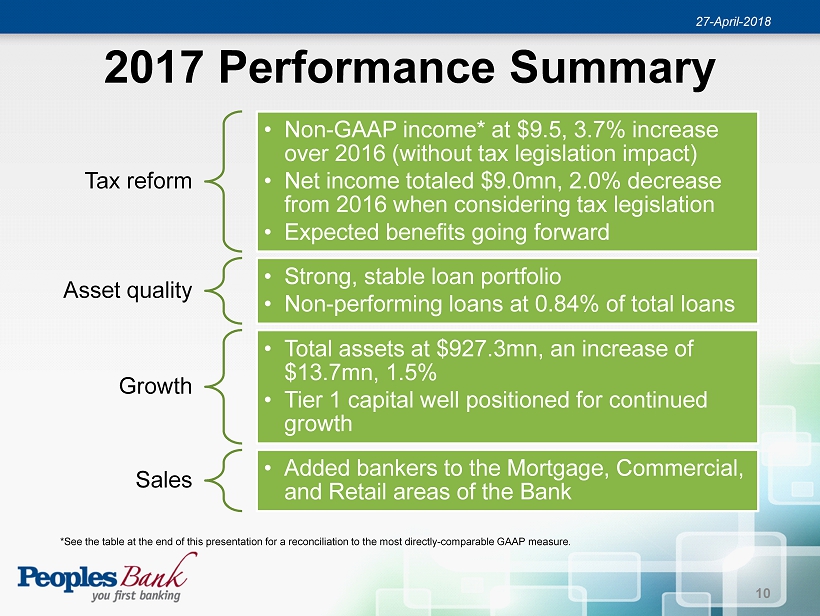
2017 Performance Summary Tax reform • Non - GAAP income* at $9.5, 3.7% increase over 2016 (without tax legislation impact) • Net income totaled $9.0mn, 2.0% decrease from 2016 when considering tax legislation • Expected benefits going forward Asset quality • Strong, stable loan portfolio • Non - performing loans at 0.84% of total loans Growth • Total assets at $927.3mn, an increase of $13.7mn, 1.5% • Tier 1 capital well positioned for continued growth Sales • Added bankers to the Mortgage, Commercial, and Retail areas of the Bank 27 - April - 2018 * See the table at the end of this presentation for a reconciliation to the most directly - comparable GAAP measure . 10
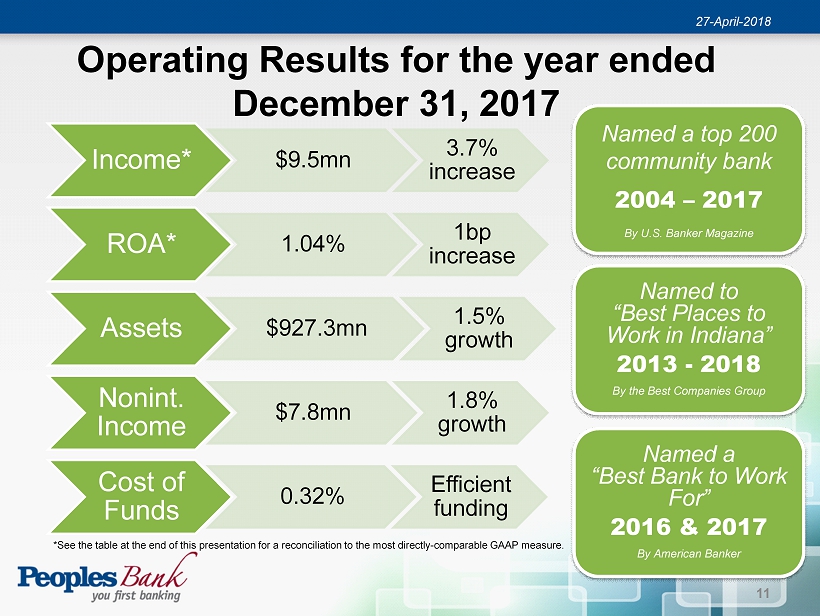
Operating Results for the year ended December 31, 2017 Income* $9.5mn 3.7% increase ROA* 1.04% 1 bp increase Assets $927.3mn 1.5% growth Nonint. Income $7.8mn 1.8% growth Cost of Funds 0.32% Efficient funding Named to “Best Places to Work in Indiana” 2013 - 2018 By the Best Companies Group Named a top 200 community bank 2004 – 2017 By U.S. Banker Magazine Named a “Best Bank to Work F or” 2016 & 2017 By American Banker *See the table at the end of this presentation for a reconciliation to the most directly - comparable GAAP measure. 27 - April - 2018 11
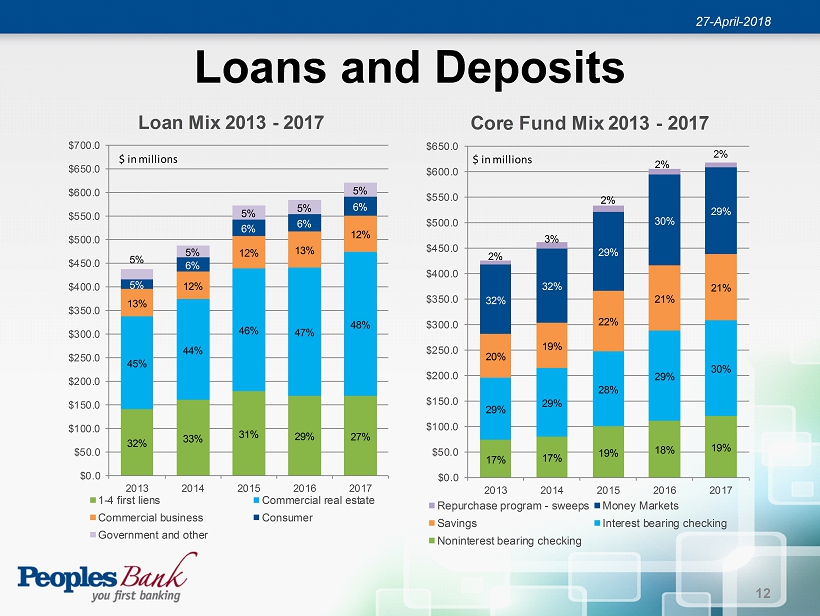
Loans and Deposits 32% 33% 31% 29% 27% 45% 44% 46% 47% 48% 13% 12% 12% 13% 12% 5% 6% 6% 6% 6% 5% 5% 5% 5% 5% $0.0 $50.0 $100.0 $150.0 $200.0 $250.0 $300.0 $350.0 $400.0 $450.0 $500.0 $550.0 $600.0 $650.0 $700.0 2013 2014 2015 2016 2017 Loan Mix 2013 - 2017 1-4 first liens Commercial real estate Commercial business Consumer Government and other $ in millions 17% 17% 19% 18% 19% 29% 29% 28% 29% 30% 20% 19% 22% 21% 21% 32% 32% 29% 30% 29% 2% 3% 2% 2% 2% $0.0 $50.0 $100.0 $150.0 $200.0 $250.0 $300.0 $350.0 $400.0 $450.0 $500.0 $550.0 $600.0 $650.0 2013 2014 2015 2016 2017 Core Fund Mix 2013 - 2017 Repurchase program - sweeps Money Markets Savings Interest bearing checking Noninterest bearing checking $ in millions 27 - April - 2018 12
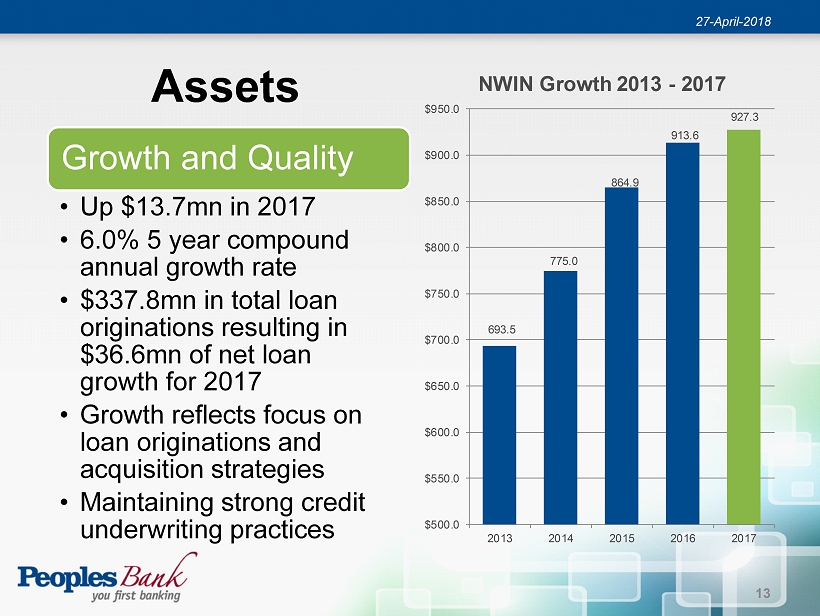
Assets 693.5 775.0 864.9 913.6 927.3 $500.0 $550.0 $600.0 $650.0 $700.0 $750.0 $800.0 $850.0 $900.0 $950.0 2013 2014 2015 2016 2017 NWIN Growth 2013 - 2017 Growth and Quality • Up $13.7mn in 2017 • 6.0% 5 year compound annual growth rate • $337.8mn in total loan originations resulting in $36.6mn of net loan growth for 2017 • Growth reflects focus on loan originations and acquisition strategies • Maintaining strong credit underwriting practices 27 - April - 2018 13
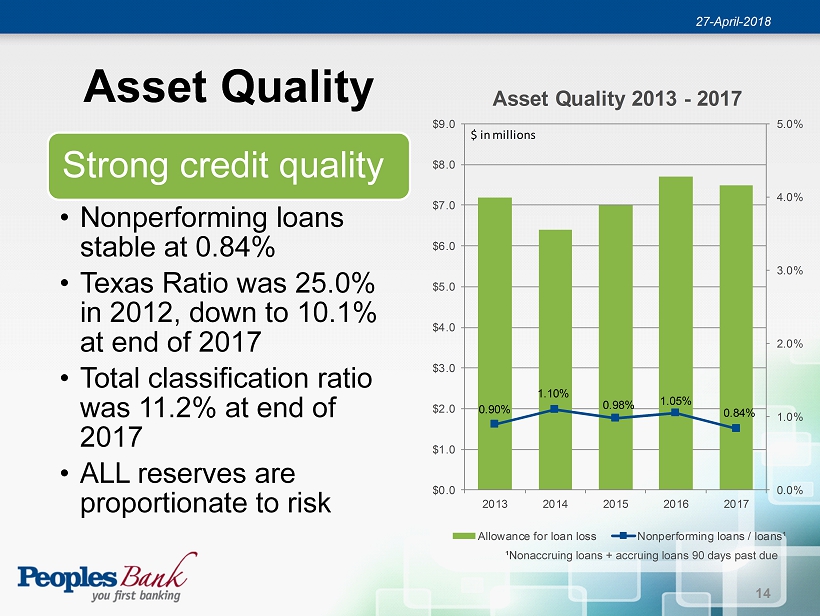
Asset Quality ¹Nonaccruing loans + accruing loans 90 days past due 0.90% 1.10% 0.98% 1.05% 0.84% 0.0% 1.0% 2.0% 3.0% 4.0% 5.0% $0.0 $1.0 $2.0 $3.0 $4.0 $5.0 $6.0 $7.0 $8.0 $9.0 2013 2014 2015 2016 2017 Asset Quality 2013 - 2017 Allowance for loan loss Nonperforming loans / loans¹ $ in millions Strong credit quality • Nonperforming loans stable at 0.84% • Texas Ratio was 25.0% in 2012, down to 10.1% at end of 2017 • Total classification ratio was 11.2% at end of 2017 • ALL reserves are proportionate to risk 27 - April - 2018 14
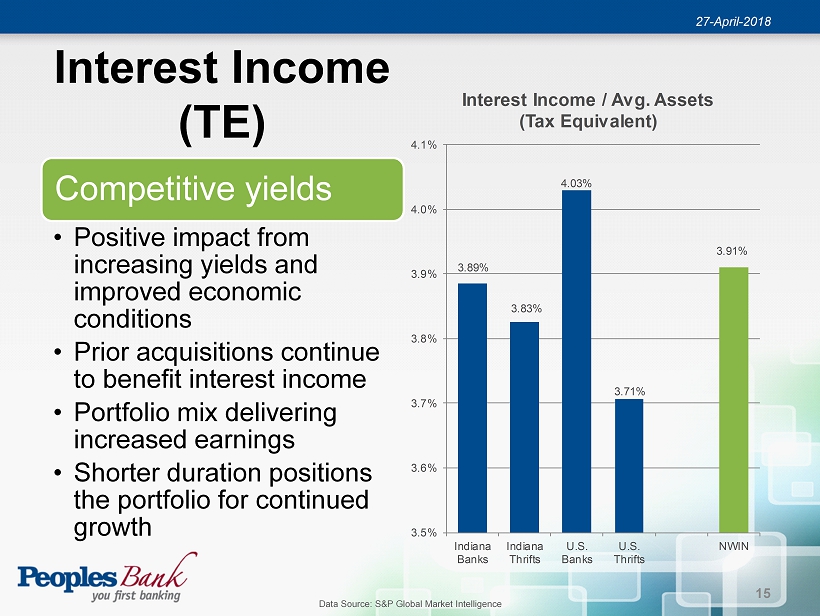
Interest Income (TE) Data Source: S&P Global Market Intelligence 3.89% 3.83% 4.03% 3.71% 3.91% 3.5% 3.6% 3.7% 3.8% 3.9% 4.0% 4.1% Indiana Banks Indiana Thrifts U.S. Banks U.S. Thrifts NWIN Interest Income / Avg. Assets (Tax Equivalent) Competitive yields • Positive impact from increasing yields and improved economic conditions • Prior acquisitions continue to benefit interest income • Portfolio mix delivering increased earnings • Shorter duration positions the portfolio for continued growth 27 - April - 2018 15
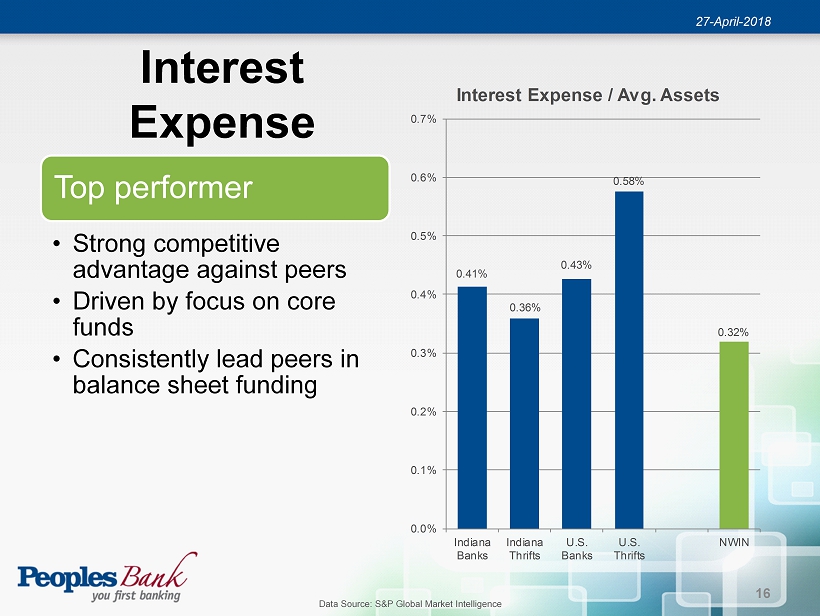
Interest Expense Top performer • Strong competitive advantage against peers • Driven by focus on core funds • Consistently lead peers in balance sheet funding Data Source: S&P Global Market Intelligence 0.41% 0.36% 0.43% 0.58% 0.32% 0.0% 0.1% 0.2% 0.3% 0.4% 0.5% 0.6% 0.7% Indiana Banks Indiana Thrifts U.S. Banks U.S. Thrifts NWIN Interest Expense / Avg. Assets 27 - April - 2018 16
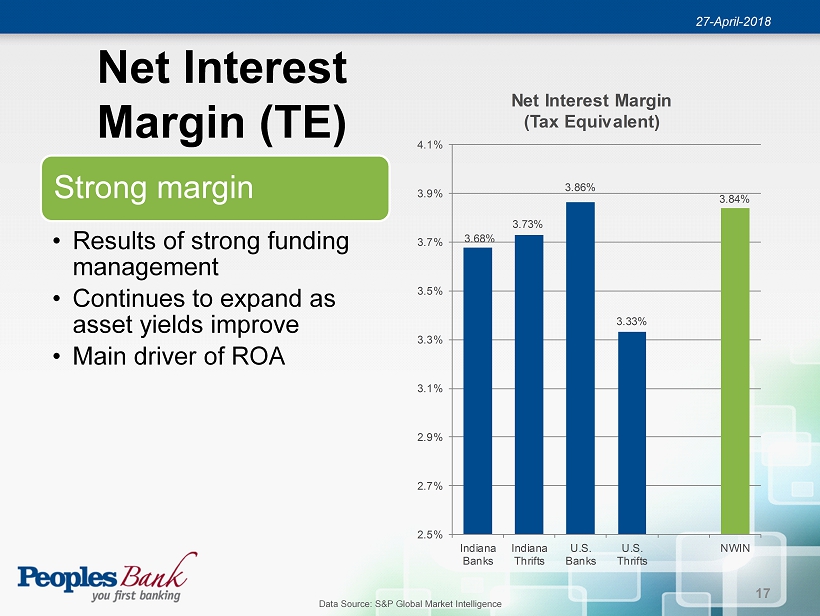
Net Interest Margin (TE) Strong margin • Results of strong funding management • Continues to expand as asset yields improve • Main driver of ROA Data Source: S&P Global Market Intelligence 3.68% 3.73% 3.86% 3.33% 3.84% 2.5% 2.7% 2.9% 3.1% 3.3% 3.5% 3.7% 3.9% 4.1% Indiana Banks Indiana Thrifts U.S. Banks U.S. Thrifts NWIN Net Interest Margin (Tax Equivalent) 27 - April - 2018 17
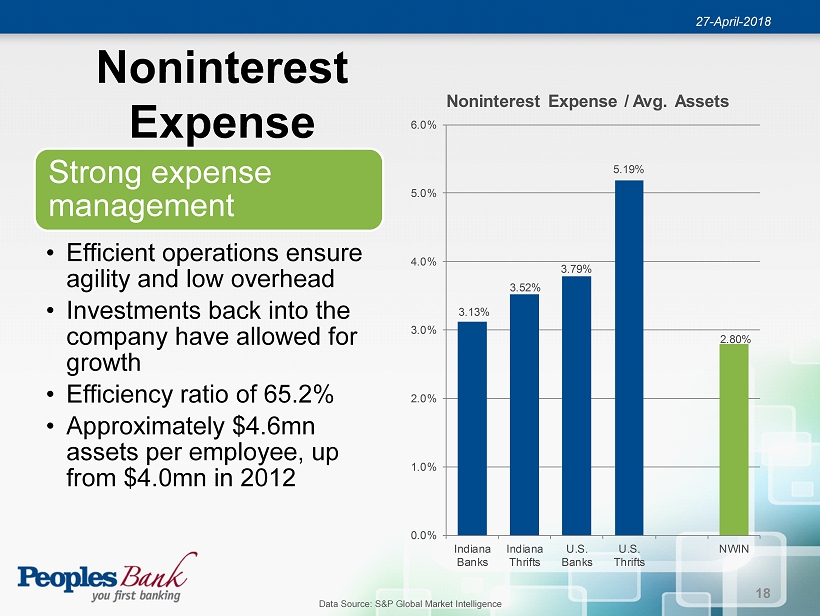
Noninterest Expense Strong expense management • Efficient operations ensure agility and low overhead • Investments back into the company have allowed for growth • Efficiency ratio of 65.2% • Approximately $4.6mn assets per employee, up from $4.0mn in 2012 Data Source: S&P Global Market Intelligence 3.13% 3.52% 3.79% 5.19% 2.80% 0.0% 1.0% 2.0% 3.0% 4.0% 5.0% 6.0% Indiana Banks Indiana Thrifts U.S. Banks U.S. Thrifts NWIN Noninterest Expense / Avg. Assets 27 - April - 2018 18
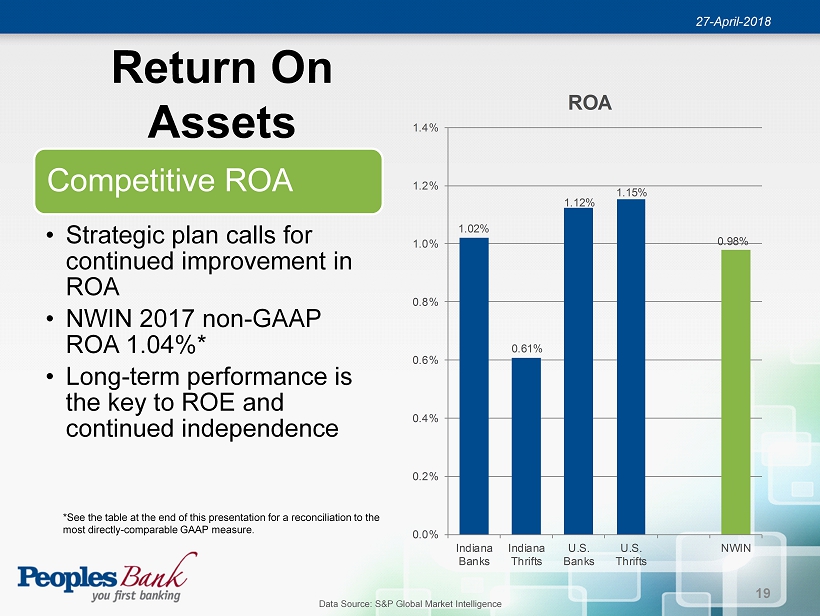
Return On Assets Competitive ROA • Strategic plan calls for continued improvement in ROA • NWIN 2017 non - GAAP ROA 1.04%* • Long - term performance is the key to ROE and continued independence Data Source: S&P Global Market Intelligence 1.02% 0.61% 1.12% 1.15% 0.98% 0.0% 0.2% 0.4% 0.6% 0.8% 1.0% 1.2% 1.4% Indiana Banks Indiana Thrifts U.S. Banks U.S. Thrifts NWIN ROA 27 - April - 2018 *See the table at the end of this presentation for a reconciliation to the most directly - comparable GAAP measure. 19
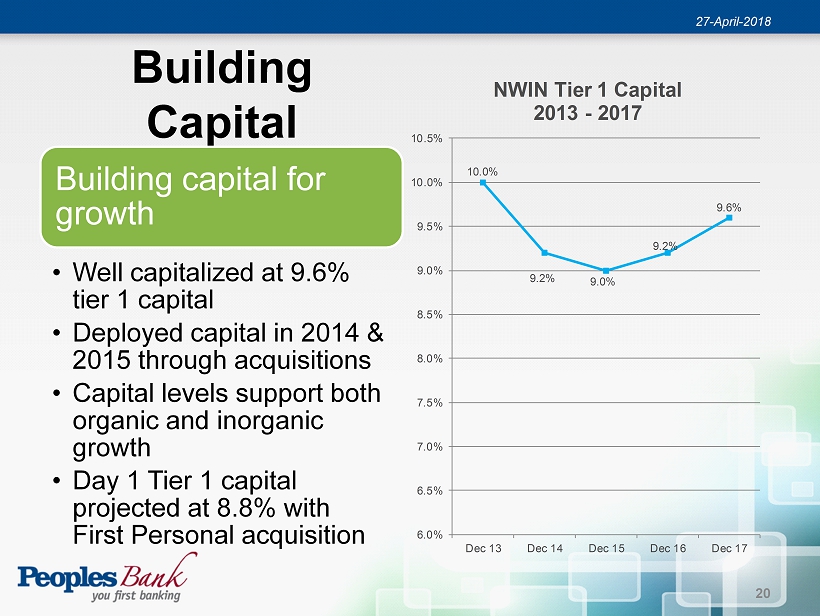
Building Capital 10.0% 9.2% 9.0% 9.2% 9.6% 6.0% 6.5% 7.0% 7.5% 8.0% 8.5% 9.0% 9.5% 10.0% 10.5% Dec 13 Dec 14 Dec 15 Dec 16 Dec 17 NWIN Tier 1 Capital 2013 - 2017 Building capital for growth • Well capitalized at 9.6% tier 1 capital • Deployed capital in 2014 & 2015 through acquisitions • Capital levels support both organic and inorganic growth • Day 1 Tier 1 capital projected at 8.8% with First Personal acquisition 27 - April - 2018 20
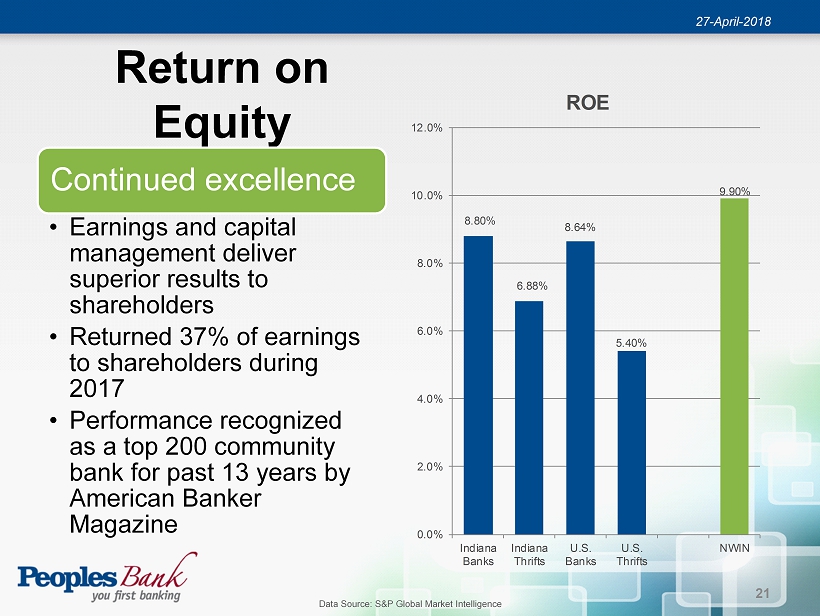
Return on Equity Continued excellence • Earnings and capital management deliver superior results to shareholders • Returned 37% of earnings to shareholders during 2017 • Performance recognized as a top 200 community bank for past 13 years by American Banker Magazine Data Source: S&P Global Market Intelligence 8.80% 6.88% 8.64% 5.40% 9.90% 0.0% 2.0% 4.0% 6.0% 8.0% 10.0% 12.0% Indiana Banks Indiana Thrifts U.S. Banks U.S. Thrifts NWIN ROE 27 - April - 2018 21
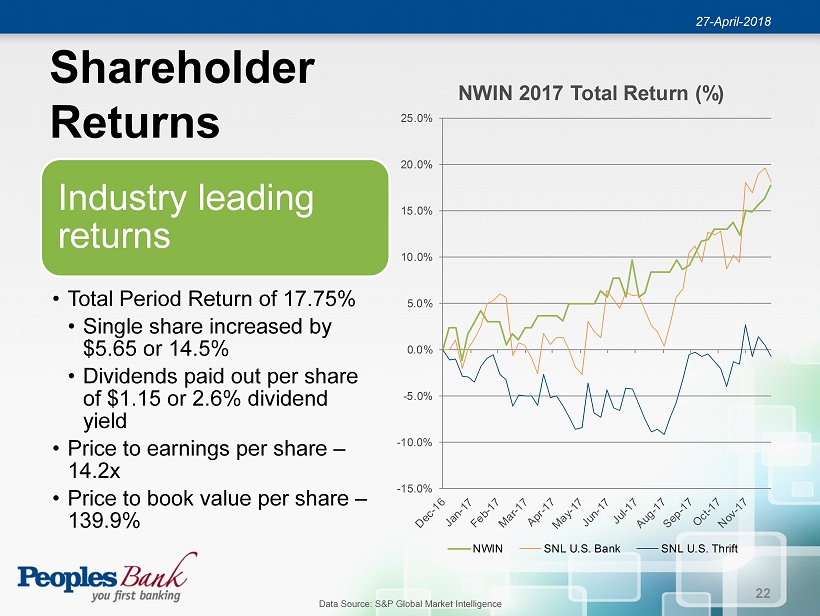
Shareholder Returns Industry leading returns • Total Period Return of 17.75% • Single share increased by $5.65 or 14.5% • Dividends paid out per share of $1.15 or 2.6% dividend yield • Price to earnings per share – 14.2x • Price to book value per share – 139.9% Data Source: S&P Global Market Intelligence -15.0% -10.0% -5.0% 0.0% 5.0% 10.0% 15.0% 20.0% 25.0% NWIN 2017 Total Return (%) NWIN SNL U.S. Bank SNL U.S. Thrift 27 - April - 2018 22

FIRST PERSONAL ACQUISITION 27 - April - 2018 23
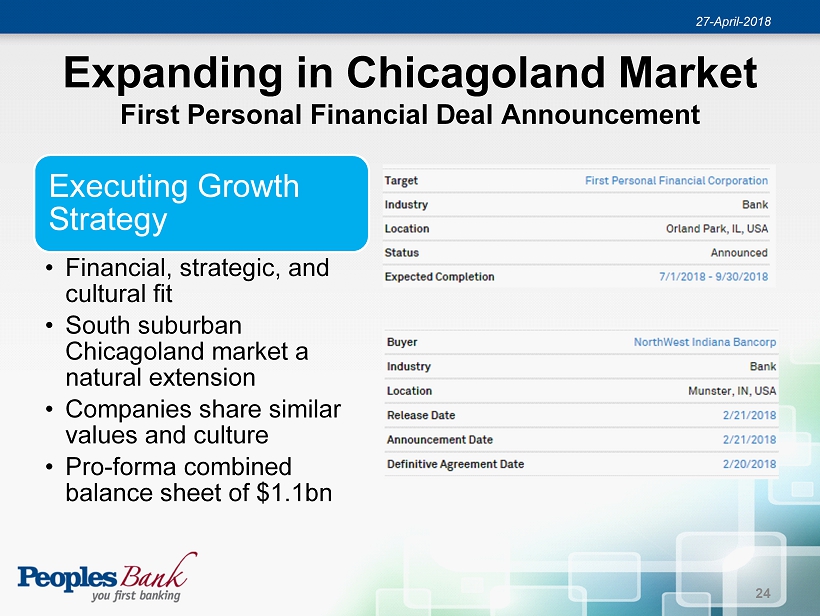
Expanding in Chicagoland Market First Personal Financial Deal Announcement Executing Growth Strategy • Financial, strategic, and cultural fit • South suburban Chicagoland market a natural extension • Companies share similar values and culture • Pro - forma combined balance sheet of $1.1bn 27 - April - 2018 24
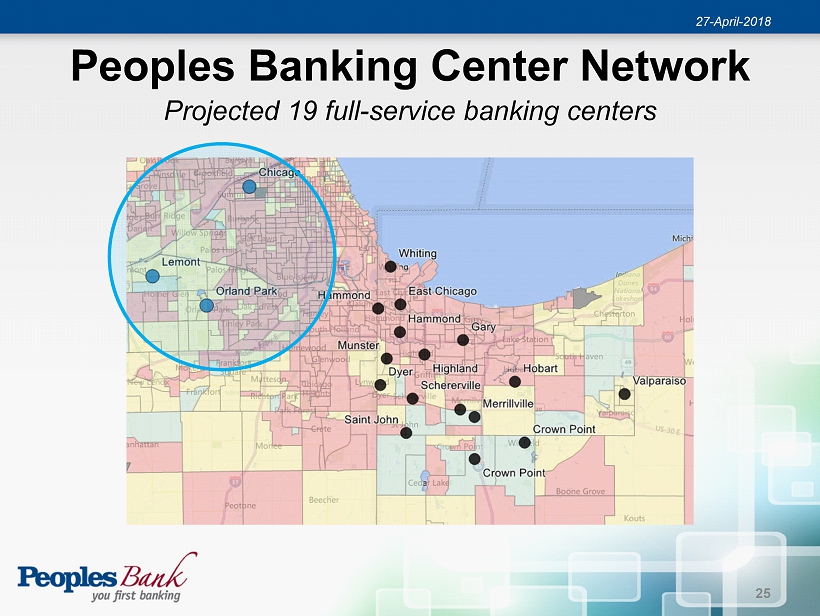
Peoples Banking Center Network Projected 19 full - service banking centers 27 - April - 2018 25
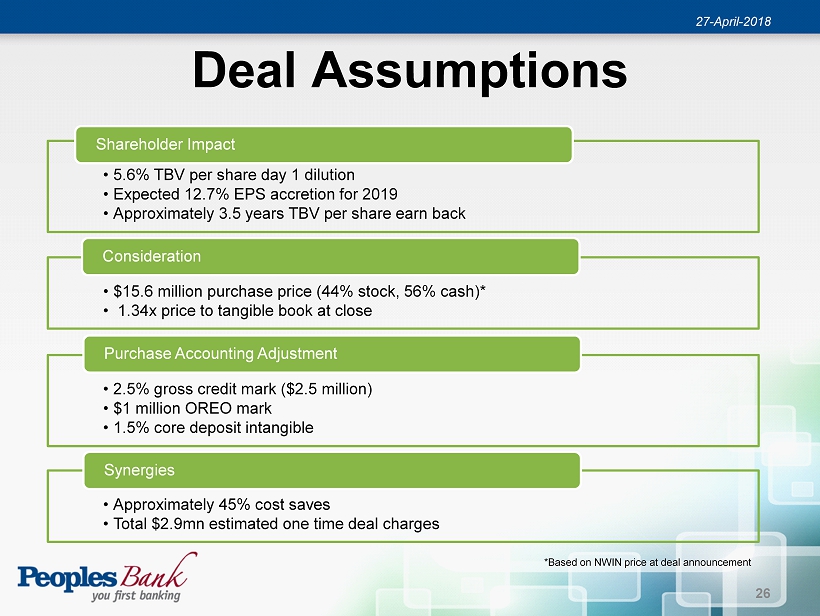
Deal Assumptions • 5.6% TBV per share day 1 dilution • Expected 12.7% EPS accretion for 2019 • Approximately 3.5 years TBV per share earn back Shareholder Impact • $15.6 million purchase price (44% stock, 56% cash)* • 1.34x price to tangible book at close Consideration • 2.5% gross credit mark ($2.5 million) • $1 million OREO mark • 1.5% core deposit intangible Purchase Accounting Adjustment • Approximately 45% cost saves • Total $2.9mn estimated one time deal charges Synergies *Based on NWIN price at deal announcement 27 - April - 2018 26
APPENDIX 27 - April - 2018 27
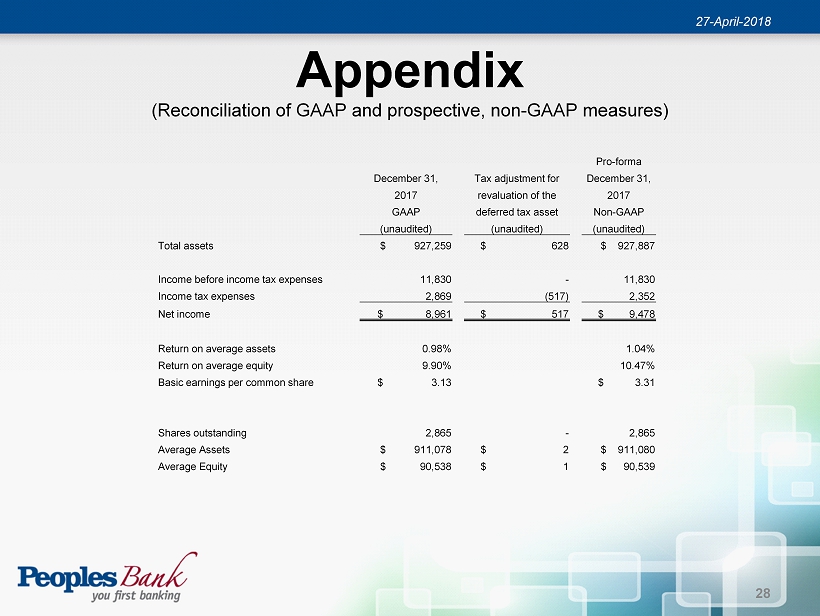
27 - April - 2018 Appendix (Reconciliation of GAAP and prospective, non - GAAP measures) Pro - forma December 31, Tax adjustment for December 31, 2017 revaluation of the 2017 GAAP deferred tax asset Non - GAAP (unaudited) (unaudited) (unaudited) Total assets $ 927,259 $ 628 $ 927,887 Income before income tax expenses 11,830 - 11,830 Income tax expenses 2,869 (517) 2,352 Net income $ 8,961 $ 517 $ 9,478 Return on average assets 0.98% 1.04% Return on average equity 9.90% 10.47% Basic earnings per common share $ 3.13 $ 3.31 Shares outstanding 2,865 - 2,865 Average Assets $ 911,078 $ 2 $ 911,080 Average Equity $ 90,538 $ 1 $ 90,539 28

Thank you.