Exhibit 99.1

This presentation may contain forward - looking statements regarding the financial performance, business prospects, growth and operating strategies of NorthWest Indiana Bancorp (“NWIN ”) for these forward - looking statements, NWIN claims the protections of the safe harbor for forward - looking statements contained in the Private Securities Litigation Reform Act of 1995 . Statements in this communication should be considered in conjunction with the other information available about NWIN, including the information in the filings NWIN makes with the SEC, including its Annual Report on Form 10 - K for the year ended December 31 , 2018 . Forward - looking statements provide current expectations or forecasts of future events and are not guarantees of future performance . The forward - looking statements are based on management’s expectations and are subject to a number of risks and uncertainties . Forward - looking statements are typically identified by using words such as “anticipate,” “estimate,” “project,” “intend,” “plan,” “believe,” “will” and similar expressions in connection with any discussion of future operating or financial performance . Although management believes that the expectations reflected in such forward - looking statements are reasonable, actual results may differ materially from those expressed or implied in such statements . Risks and uncertainties that could cause actual results to differ materially include : difficulties and delays in integrating NWIN’s business with the businesses of institutions NWIN has acquired or fully realizing cost savings and other benefits from those acquisitions ; changes in asset quality and credit risk ; the inability to sustain revenue and earnings growth ; changes in interest rates and capital markets ; inflation ; customer acceptance of NWIN’s products and services ; customer borrowing, repayment, investment, and deposit practices ; customer disintermediation ; the introduction, withdrawal, success, and timing of business initiatives ; competitive conditions ; the inability to realize cost savings or revenues or to implement integration plans and other consequences associated with mergers, acquisitions, and divestitures ; economic conditions ; and the impact, extent, and timing of technological changes, capital management activities, and other actions of the Federal Reserve Board and legislative and regulatory actions and reforms . FORWARD - LOOKING STATEMENTS 3
This presentation refers to certain financial measures that are identified as non - GAAP . The Bancorp believes that these non - GAAP measures are helpful to investors to better understand the Bancorp’s assets , earnings, and shareholders’ equity at the date of this presentation . This supplemental information should not be considered in isolation or as a substitute for the related GAAP measures . See the attached table at the end of this presentation for a reconciliation of the non - GAAP measures identified herein and their most comparable GAAP measures . DISCLOSURES REGARDING NON - GAAP MEASURES 4

5 APRIL 25, 2019
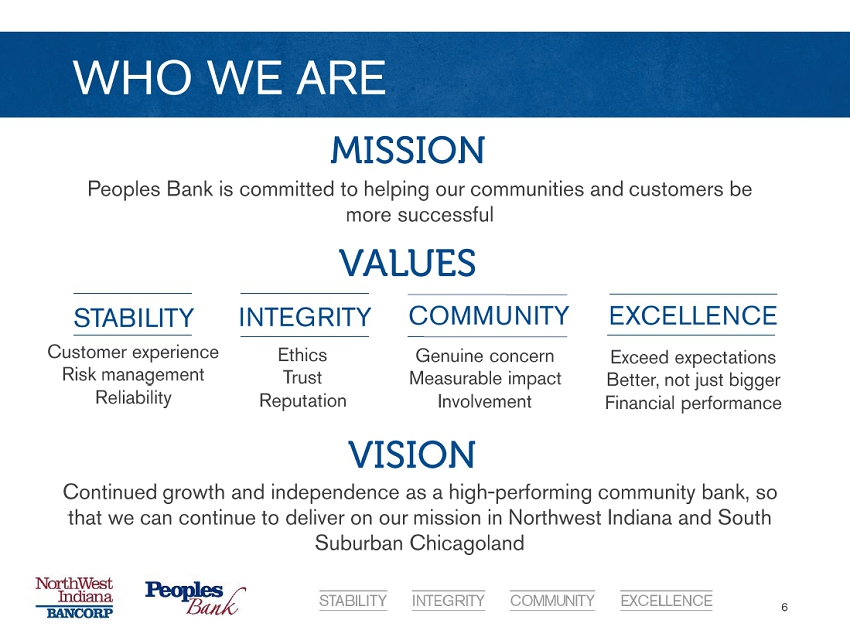
WHO WE ARE 6 MISSION Peoples Bank is committed to helping our communities and customers be more successful VALUES Continued growth and independence as a high - performing community bank, so that we can continue to deliver on our mission in Northwest Indiana and South Suburban Chicagoland VISION Customer experience Risk management Reliability Ethics Trust Reputation Genuine concern Measurable impact Involvement Exceed expectations B etter, n ot just bigger Financial performance STABILITY INTEGRITY COMMUNITY EXCELLENCE
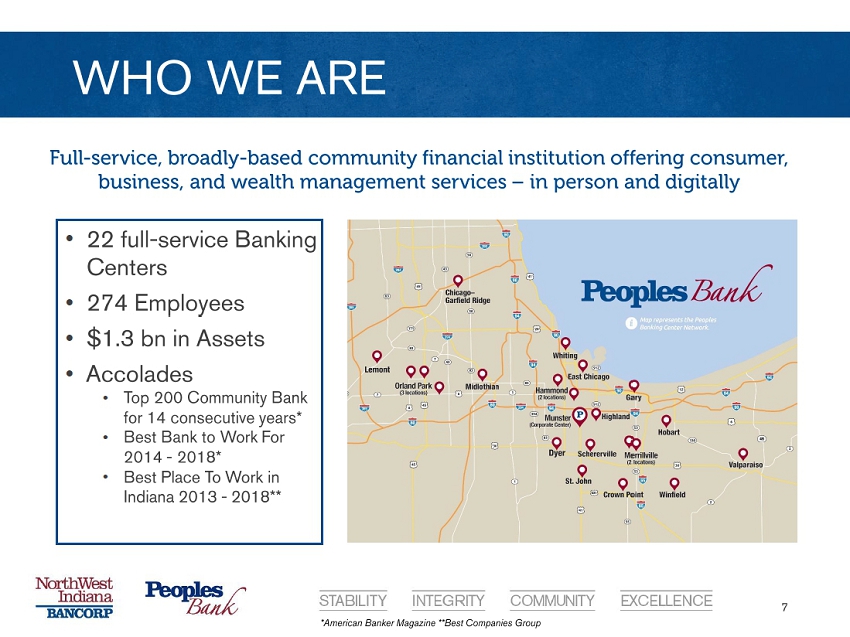
• 22 full - service Banking C enters • 274 Employees • $1.3 bn in Assets • Accolades • Top 200 Community Bank for 14 consecutive years* • Best Bank to Work For 2014 - 2018* • Best Place To Work in Indiana 2013 - 2018** WHO WE ARE 7 Full - service, broadly - based community financial institution offering consumer, business, and wealth management services – in person and digitally *American Banker Magazine **Best Companies Group
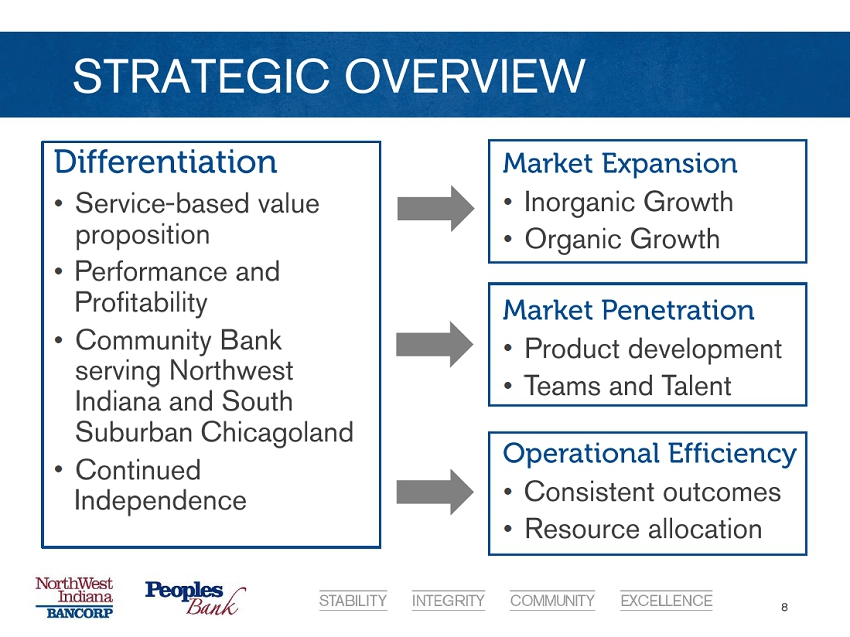
Differentiation • Service - based value proposition • Performance and Profitability • Community Bank serving Northwest Indiana and South Suburban Chicagoland • Continued Independence STRATEGIC OVERVIEW 8 Market Expansion • Inorganic Growth • Organic Growth Market Penetration • Product development • Teams and Talent Operational Efficiency • Consistent outcomes • Resource allocation
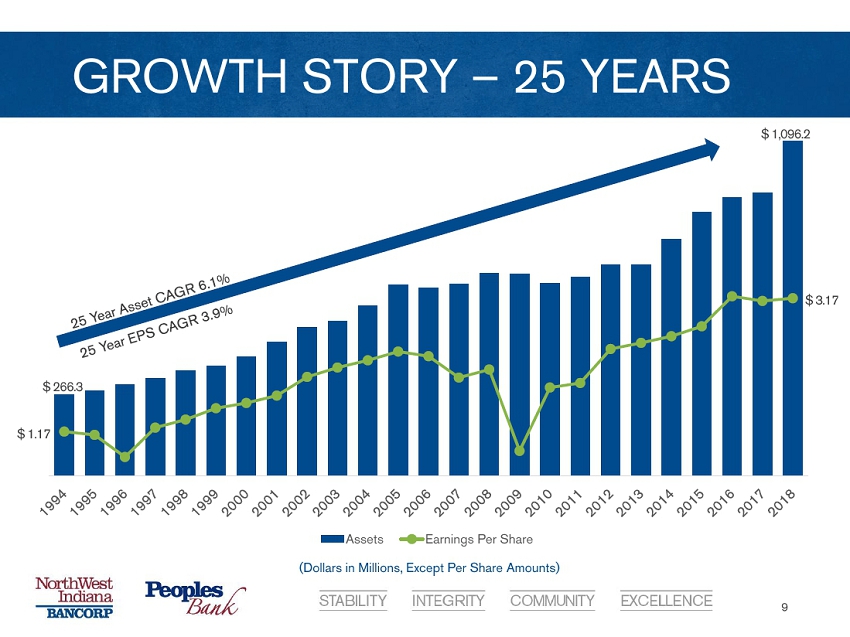
1994 1995 1996 1997 1998 1999 2000 2001 2002 2003 2004 2005 2006 2007 2008 2009 2010 2011 2012 2013 2014 2015 2016 2017 2018 Assets Earnings Per Share GROWTH STORY – 25 YEARS 9 $ 1,096.2 $ 266.3 (Dollars in Millions, Except Per Share Amounts) $ 1.17 $ 3.17
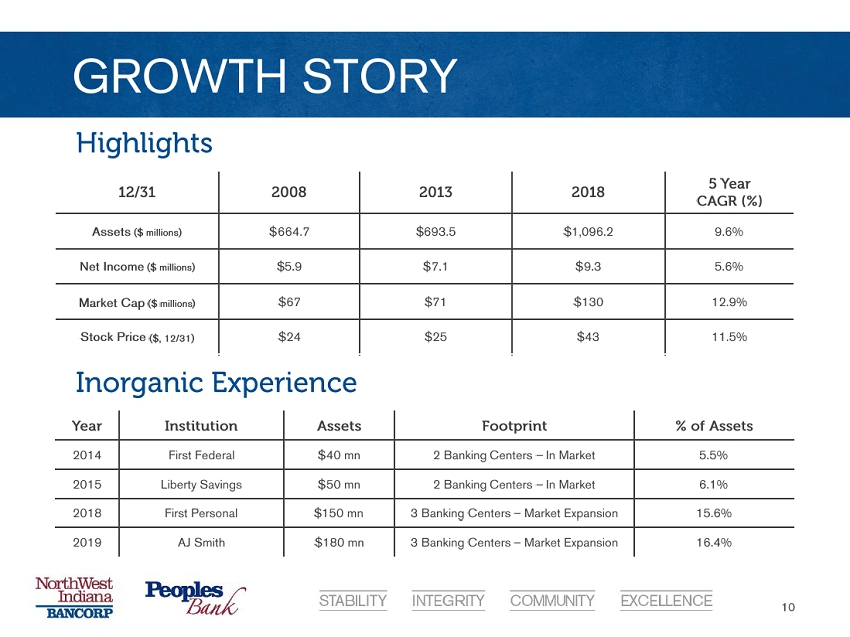
GROWTH STORY 10 Year Institution Assets Footprint % of Assets 2014 First Federal $ 40 mn 2 Banking Centers – In Market 5.5% 2015 Liberty Savings $ 50 mn 2 Banking Centers – In Market 6.1% 2018 First Personal $ 150 mn 3 Banking Centers – Market Expansion 15.6% 2019 AJ Smith $180 mn 3 Banking Centers – Market Expansion 16.4% Inorganic Experience 12/31 2008 2013 2018 5 Year CAGR (%) Assets ($ millions) $ 664.7 $ 693.5 $ 1,096.2 9.6% Net Income ($ millions) $ 5.9 $ 7.1 $ 9.3 5.6% Market Cap ($ millions ) $67 $71 $130 12.9% Stock Price ($, 12/31) $24 $25 $43 11.5% Highlights
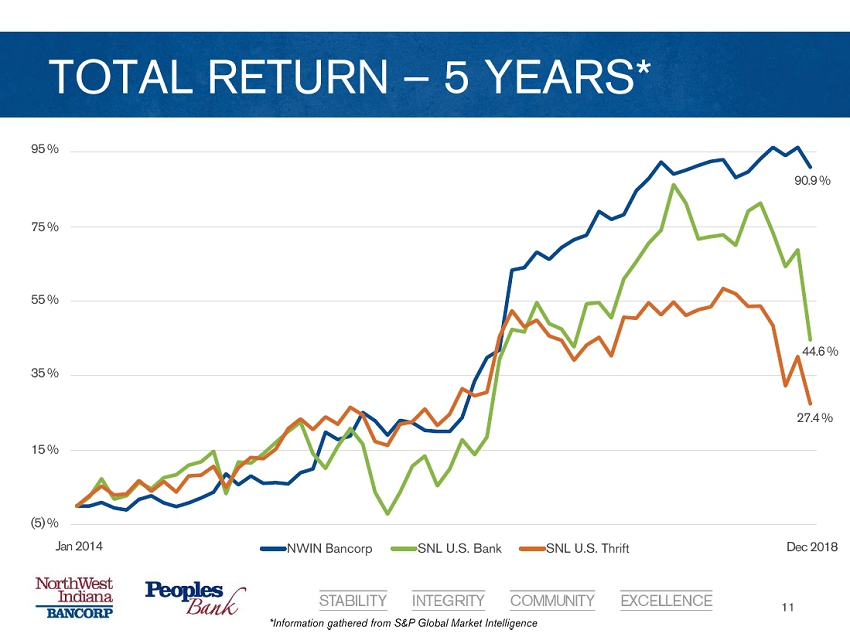
NWIN Bancorp SNL U.S. Bank SNL U.S. Thrift TOTAL RETURN – 5 YEARS* 11 90.9 % 44.6 % 27.4 % Jan 2014 Dec 2018 75 % 95 % 55 % 35 % 15 % (5) % *Information gathered from S&P Global Market Intelligence
12
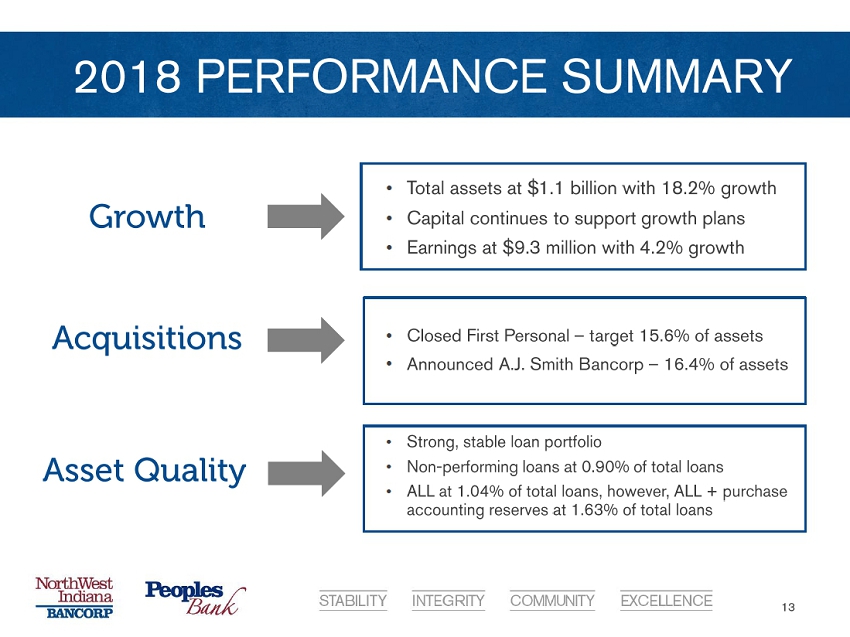
• Strong, stable loan portfolio • Non - performing loans at 0.90% of total loans • ALL at 1.04% of total loans, however, ALL + purchase accounting reserves at 1.63% of total loans 2018 PERFORMANCE SUMMARY 13 Asset Quality • Total assets at $ 1.1 billion with 18.2% growth • Capital continues to support growth plans • Earnings at $9.3 million with 4.2% growth • Closed First Personal – target 15.6% of assets • Announced A.J. Smith Bancorp – 16.4% of assets Growth Acquisitions
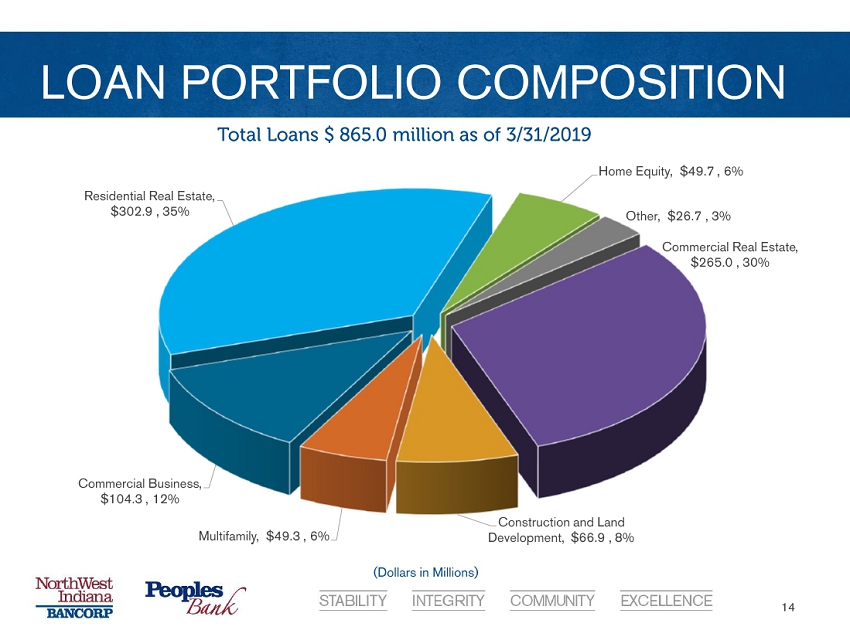
LOAN PORTFOLIO COMPOSITION 14 Total Loans $ 865.0 million as of 3/31/2019 (Dollars in Millions) Residential Real Estate , $302.9 , 35% Home Equity , $49.7 , 6% Other , $26.7 , 3% Commercial Real Estate , $265.0 , 30% Construction and Land Development , $66.9 , 8% Multifamily , $49.3 , 6% Commercial Business , $104.3 , 12%
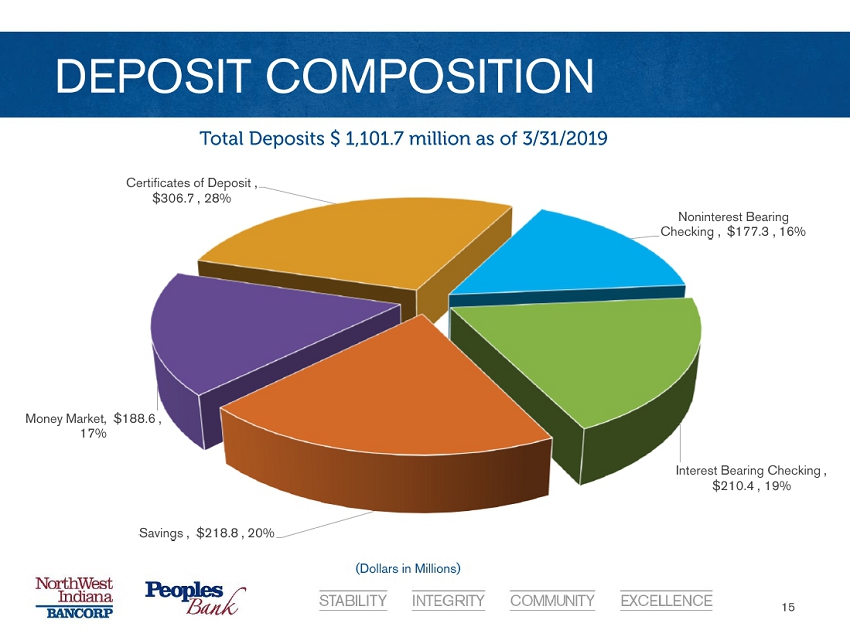
DEPOSIT COMPOSITION 15 Total Deposits $ 1,101.7 million as of 3/31/2019 (Dollars in Millions) Noninterest Bearing Checking , $177.3 , 16% Interest Bearing Checking , $210.4 , 19% Savings , $218.8 , 20% Money Market , $188.6 , 17% Certificates of Deposit , $306.7 , 28%
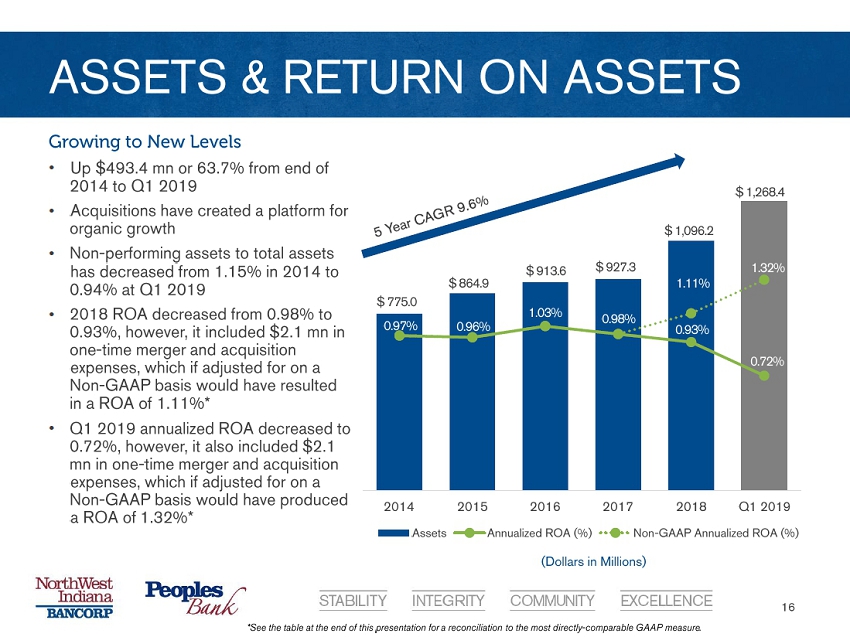
2014 2015 2016 2017 2018 Q1 2019 Assets Annualized ROA (%) Non-GAAP Annualized ROA (%) ASSETS & RETURN ON ASSETS 16 Growing to New Levels • Up $493.4 mn or 63.7% from end of 2014 to Q1 2019 • Acquisitions have created a platform for organic growth • Non - performing assets to total assets has decreased from 1.15% in 2014 to 0.94% at Q1 2019 • 2018 ROA decreased from 0.98% to 0.93%, however, it included $2.1 mn in one - time merger and acquisition expenses, which if adjusted for on a Non - GAAP basis would have resulted in a ROA of 1.11%* • Q1 2019 annualized ROA decreased to 0.72%, however, it also included $2.1 mn in one - time merger and acquisition expenses, which if adjusted for on a Non - GAAP basis would have produced a ROA of 1.32%* $ 775.0 $ 864.9 $ 913.6 $ 927.3 $ 1,096.2 (Dollars in Millions) $ 1,268.4 0.97% 0.96% 1.03% 0.98% 0.93% 0.72% * See the table at the end of this presentation for a reconciliation to the most directly - comparable GAAP measure . 1.32% 1.11%
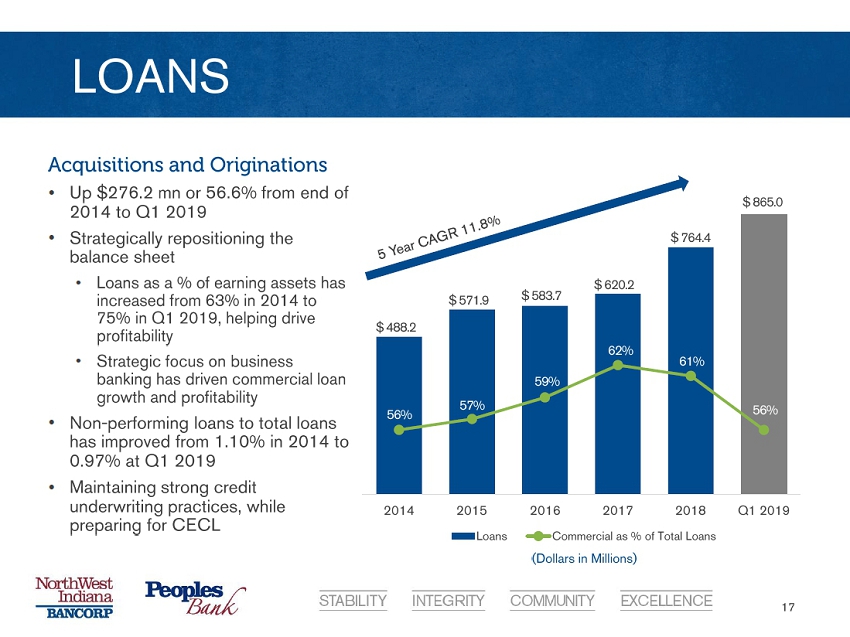
2014 2015 2016 2017 2018 Q1 2019 Loans Commercial as % of Total Loans LOANS 17 Acquisitions and Originations • Up $276.2 mn or 56.6% from end of 2014 to Q1 2019 • Strategically repositioning the balance sheet • Loans as a % of earning assets has increased from 63% in 2014 to 75% in Q1 2019, helping drive profitability • Strategic focus on business banking has driven commercial loan growth and profitability • Non - performing loans to total loans has improved from 1.10% in 2014 to 0.97% at Q1 2019 • Maintaining strong credit underwriting practices, while preparing for CECL $ 488.2 $ 571.9 $ 583.7 $ 620.2 $ 764.4 $ 865.0 (Dollars in Millions) 56% 57% 59% 62% 61% 56%
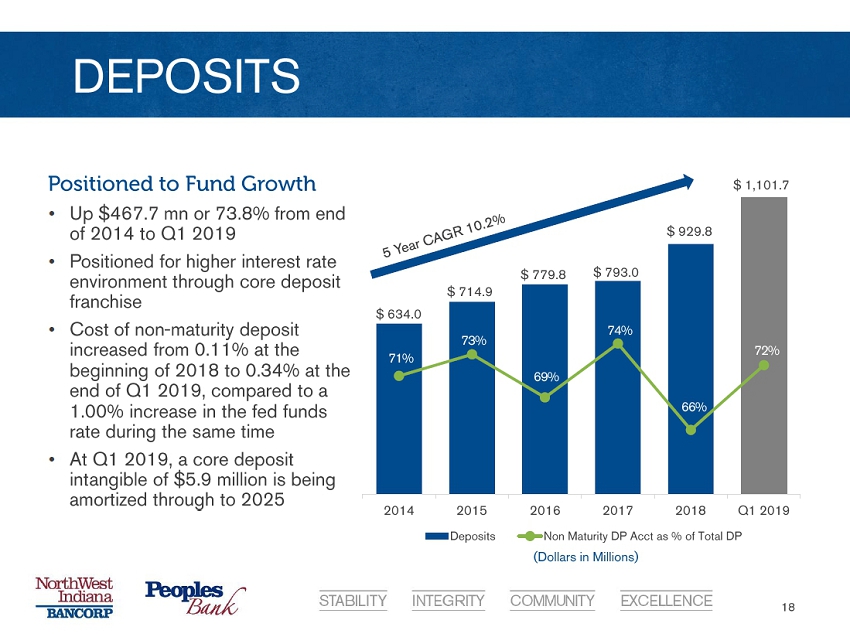
2014 2015 2016 2017 2018 Q1 2019 Deposits Non Maturity DP Acct as % of Total DP DEPOSITS 18 Positioned to Fund Growth • Up $467.7 mn or 73.8% from end of 2014 to Q1 2019 • Positioned for higher interest rate environment through core deposit franchise • Cost of non - maturity deposit increased from 0.11% at the beginning of 2018 to 0.34% at the end of Q1 2019, compared to a 1.00% increase in the fed funds rate during the same time • At Q1 2019, a core deposit intangible of $5.9 million is being amortized through to 2025 $ 634.0 $ 714.9 $ 779.8 $ 793.0 $ 929.8 $ 1,101.7 (Dollars in Millions) 71% 73% 69% 74% 66% 72%
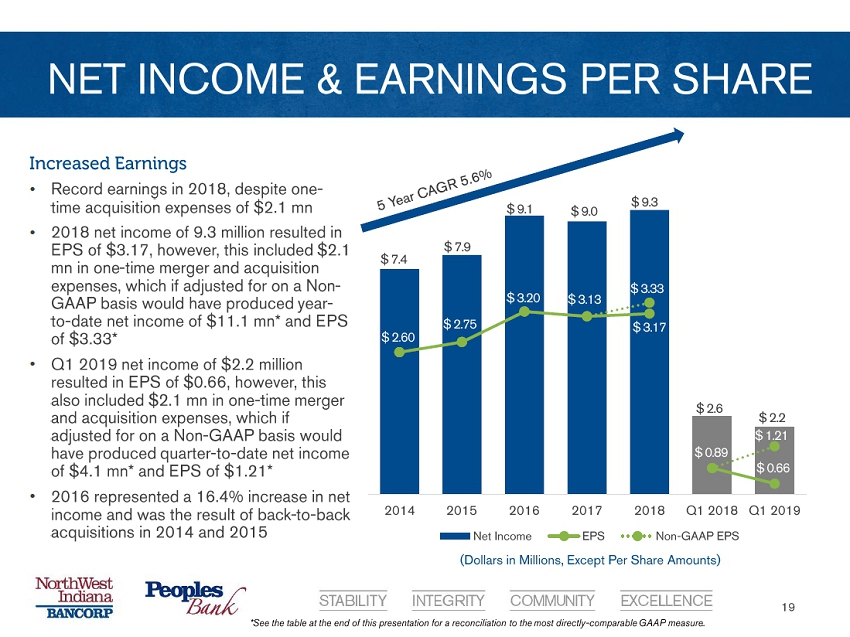
2014 2015 2016 2017 2018 Q1 2018 Q1 2019 Net Income EPS Non-GAAP EPS NET INCOME & EARNINGS PER SHARE 19 Increased Earnings • Record earnings in 2018, despite one - time acquisition expenses of $2.1 mn • 2018 net income of 9.3 million resulted in EPS of $3.17, however, this included $2.1 mn in one - time merger and acquisition expenses, which if adjusted for on a Non - GAAP basis would have produced year - to - date net income of $11.1 mn* and EPS of $3.33* • Q1 2019 net income of $2.2 million resulted in EPS of $0.66, however, this also included $2.1 mn in one - time merger and acquisition expenses, which if adjusted for on a Non - GAAP basis would have produced quarter - to - date net income of $4.1 mn* and EPS of $1.21* • 2016 represented a 16.4% increase in net income and was the result of back - to - back acquisitions in 2014 and 2015 $ 7.4 $ 7.9 $ 9.1 $ 9.0 $ 9.3 $ 2.2 $ 2.6 (Dollars in Millions, Except Per Share Amounts) $ 2.60 $ 2.75 $ 3.20 $ 3.13 $ 3.33 $ 0.89 $ 0.66 * See the table at the end of this presentation for a reconciliation to the most directly - comparable GAAP measure . $ 3.17 $ 1.21
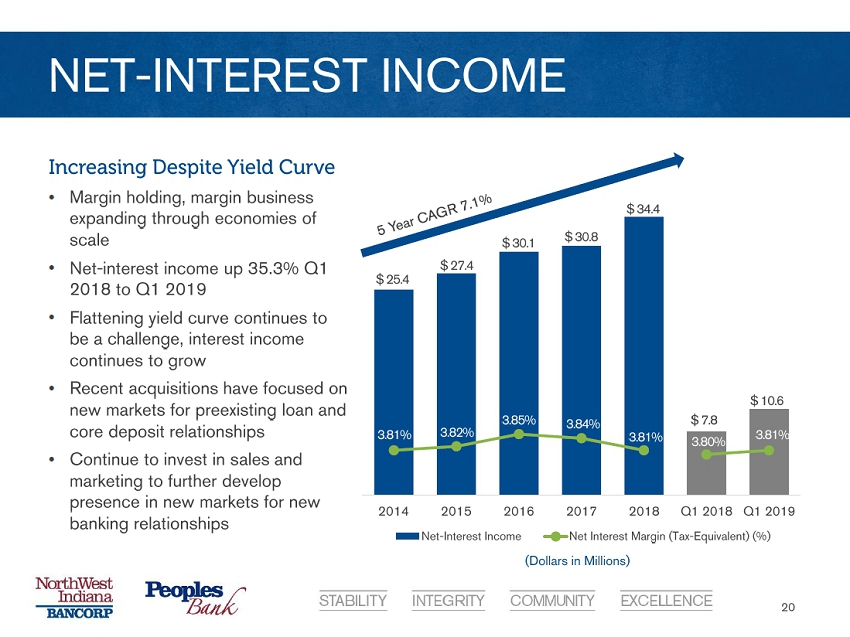
2014 2015 2016 2017 2018 Q1 2018 Q1 2019 Net-Interest Income Net Interest Margin (Tax-Equivalent) (%) NET - INTEREST INCOME 20 Increasing Despite Yield Curve • Margin holding, margin business expanding through economies of scale • Net - interest income up 35.3% Q1 2018 to Q1 2019 • Flattening yield curve continues to be a challenge, interest income continues to grow • Recent acquisitions have focused on new markets for preexisting loan and core deposit relationships • Continue to invest in sales and marketing to further develop presence in new markets for new banking relationships $ 25.4 $ 27.4 $ 30.1 $ 30.8 $ 34.4 $ 10.6 $ 7.8 (Dollars in Millions) 3.81% 3.82% 3.85% 3.84% 3.81% 3.80% 3.81%
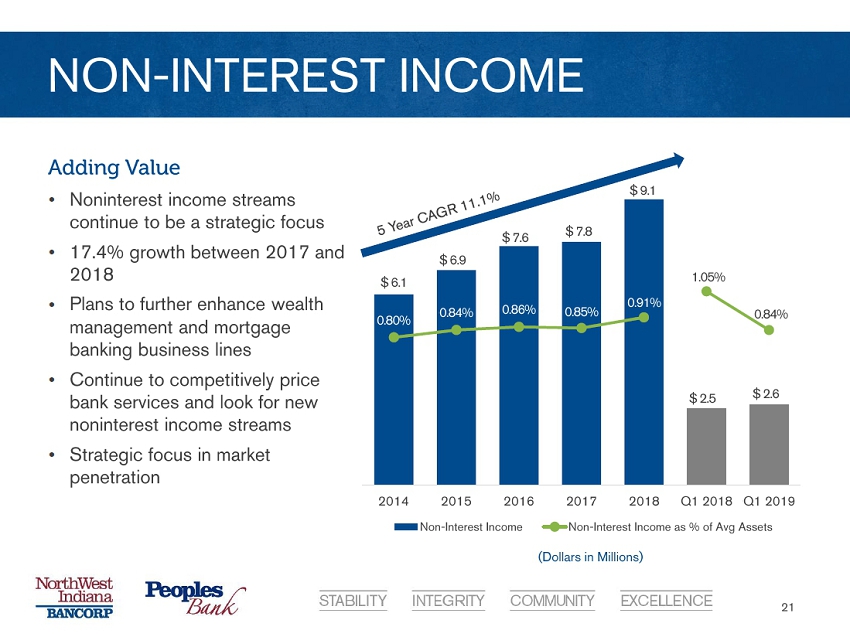
2014 2015 2016 2017 2018 Q1 2018 Q1 2019 Non-Interest Income Non-Interest Income as % of Avg Assets NON - INTEREST INCOME 21 Adding Value • Noninterest income streams continue to be a strategic focus • 17.4% growth between 2017 and 2018 • Plans to further enhance wealth management and mortgage banking business lines • Continue to competitively price bank services and look for new noninterest income streams • Strategic focus in market penetration $ 6.1 $ 6.9 $ 7.6 $ 7.8 $ 9.1 $ 2.6 $ 2.5 (Dollars in Millions) 0.80% 0.84% 0.86% 0.85% 0.91% 1.05% 0.84%
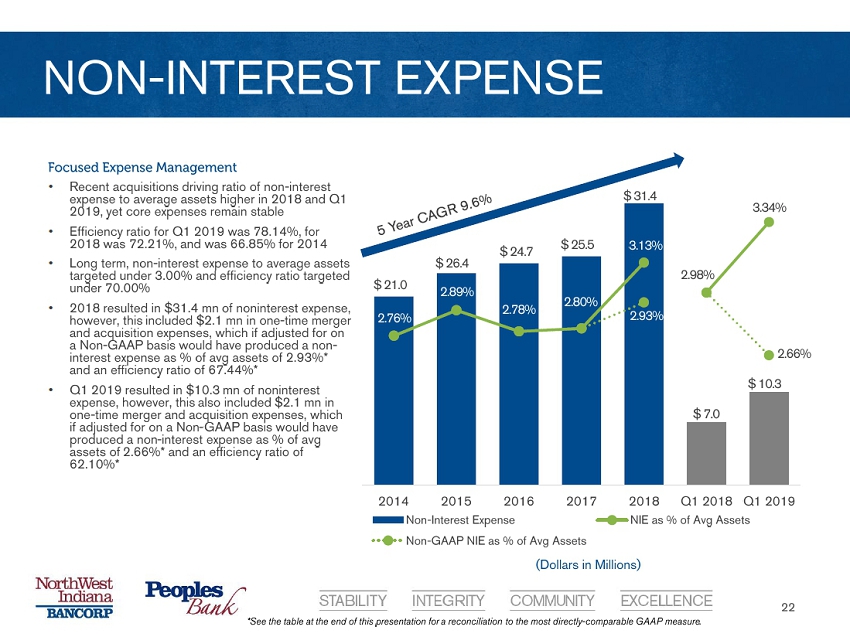
2014 2015 2016 2017 2018 Q1 2018 Q1 2019 Non-Interest Expense NIE as % of Avg Assets Non-GAAP NIE as % of Avg Assets NON - INTEREST EXPENSE 22 Focused Expense Management • Recent acquisitions driving ratio of non - interest expense to average assets higher in 2018 and Q1 2019, yet core expenses remain stable • Efficiency ratio for Q1 2019 was 78.14%, for 2018 was 72.21%, and was 66.85% for 2014 • Long term, non - interest expense to average assets targeted under 3.00% and efficiency ratio targeted under 70.00% • 2018 resulted in $31.4 mn of noninterest expense, however, this included $2.1 mn in one - time merger and acquisition expenses, which if adjusted for on a Non - GAAP basis would have produced a n on - interest expense as % of avg assets of 2.93%* and an efficiency ratio of 67.44%* • Q1 2019 resulted in $10.3 mn of noninterest expense, however, this also included $2.1 mn in one - time merger and acquisition expenses, which if adjusted for on a Non - GAAP basis would have produced a non - interest expense as % of avg assets of 2.66%* and an efficiency ratio of 62.10%* $ 21.0 $ 26.4 $ 24.7 $ 25.5 $ 31.4 $ 10.3 $ 7.0 (Dollars in Millions) 2.76% 2.89% 2.78% 2.80% 3.13% 2.98% 3.34% * See the table at the end of this presentation for a reconciliation to the most directly - comparable GAAP measure . 2.93% 2.66%
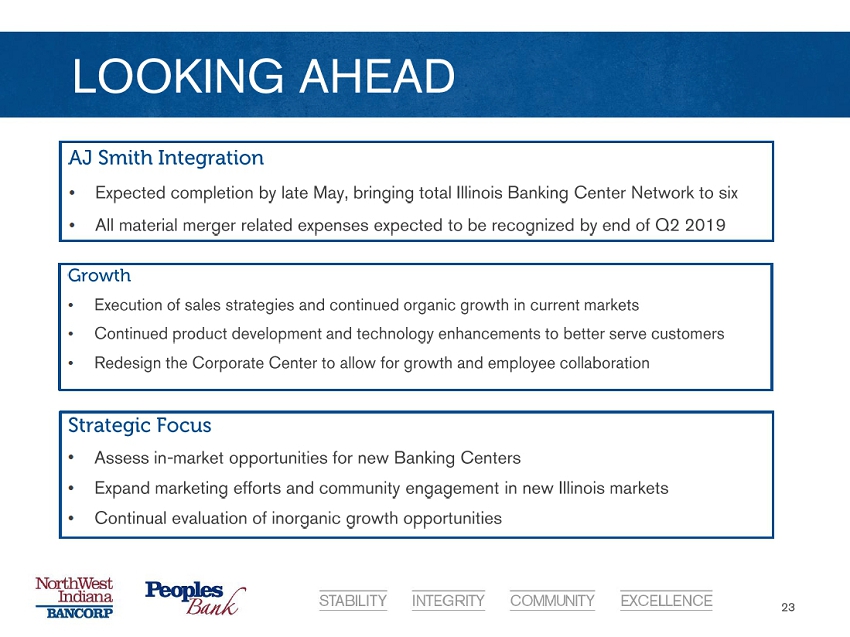
LOOKING AHEAD 23 AJ Smith Integration • Expected completion by late May, bringing total Illinois Banking Center Network to six • All material merger related expenses expected to be recognized by end of Q2 2019 Growth • Execution of sales strategies and continued organic growth in current markets • Continued product development and technology enhancements to better serve customers • Redesign the Corporate Center to allow for growth and employee collaboration Strategic Focus • Assess in - market opportunities for new Banking Centers • Expand marketing efforts and community engagement in new Illinois markets • Continual evaluation of inorganic growth opportunities

A SPECIAL THANKS 24 Randy Schwartz, and the Board and staff of First Personal Bank We will honor your work and commitment to the communities that you served so well Jerry Weberling, and the Board and staff of AJ Smith Federal Savings Bank
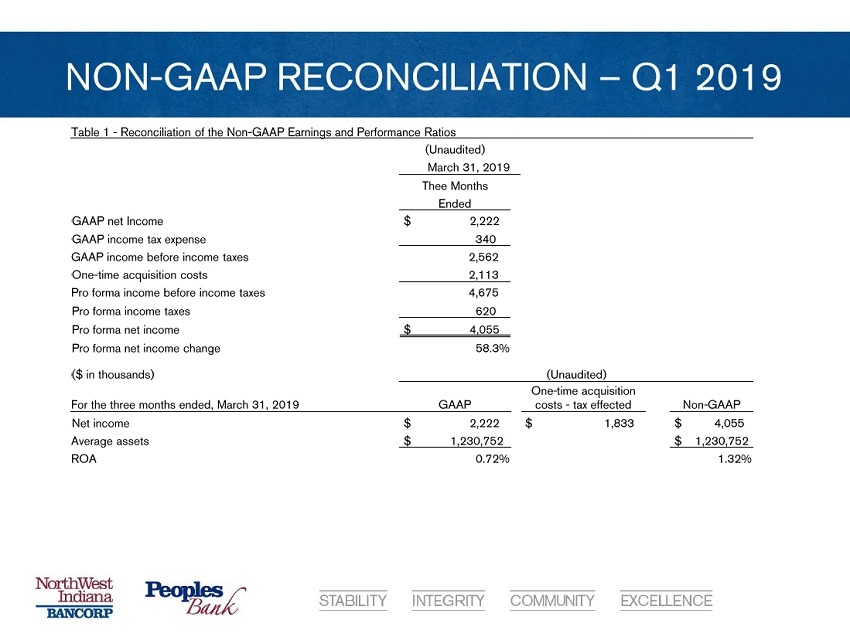
NON - GAAP RECONCILIATION – Q1 2019 Table 1 - Reconciliation of the Non - GAAP Earnings and Performance Ratios (Unaudited) March 31, 2019 Thee Months Ended GAAP net Income $ 2,222 GAAP income tax expense 340 GAAP income before income taxes 2,562 One - time acquisition costs 2,113 Pro forma income before income taxes 4,675 Pro forma income taxes 620 Pro forma net income $ 4,055 Pro forma net income change 58.3% ($ in thousands) (Unaudited) For the three months ended, March 31, 2019 GAAP One - time acquisition costs - tax effected Non - GAAP Net income $ 2,222 $ 1,833 $ 4,055 Average assets $ 1,230,752 $ 1,230,752 ROA 0.72% 1.32%
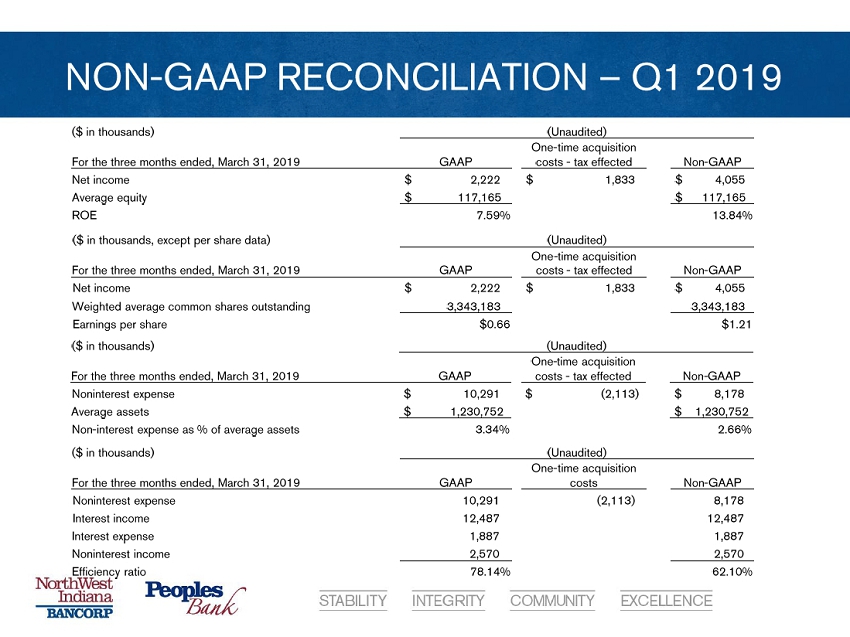
NON - GAAP RECONCILIATION – Q1 2019 ($ in thousands) (Unaudited) For the three months ended, March 31, 2019 GAAP One - time acquisition costs - tax effected Non - GAAP Net income $ 2,222 $ 1,833 $ 4,055 Average equity $ 117,165 $ 117,165 ROE 7.59% 13.84% ($ in thousands, except per share data) (Unaudited) For the three months ended, March 31, 2019 GAAP One - time acquisition costs - tax effected Non - GAAP Net income $ 2,222 $ 1,833 $ 4,055 Weighted average common shares outstanding 3,343,183 3,343,183 Earnings per share $0.66 $1.21 ($ in thousands) (Unaudited) For the three months ended, March 31, 2019 GAAP One - time acquisition costs - tax effected Non - GAAP Noninterest expense $ 10,291 $ (2,113) $ 8,178 Average assets $ 1,230,752 $ 1,230,752 Non - interest expense as % of average assets 3.34% 2.66% ($ in thousands) (Unaudited) For the three months ended, March 31, 2019 GAAP One - time acquisition costs Non - GAAP Noninterest expense 10,291 (2,113) 8,178 Interest income 12,487 12,487 Interest expense 1,887 1,887 Noninterest income 2,570 2,570 Efficiency ratio 78.14% 62.10%
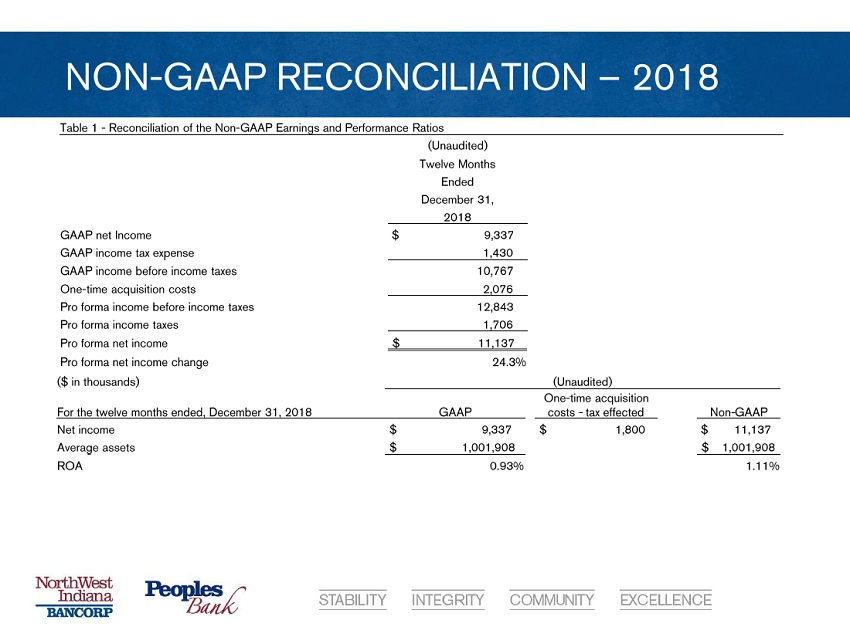
NON - GAAP RECONCILIATION – 2018 Table 1 - Reconciliation of the Non - GAAP Earnings and Performance Ratios (Unaudited) Twelve Months Ended December 31, 2018 GAAP net Income $ 9,337 GAAP income tax expense 1,430 GAAP income before income taxes 10,767 One - time acquisition costs 2,076 Pro forma income before income taxes 12,843 Pro forma income taxes 1,706 Pro forma net income $ 11,137 Pro forma net income change 24.3% ($ in thousands) (Unaudited) For the twelve months ended, December 31, 2018 GAAP One - time acquisition costs - tax effected Non - GAAP Net income $ 9,337 $ 1,800 $ 11,137 Average assets $ 1,001,908 $ 1,001,908 ROA 0.93% 1.11%
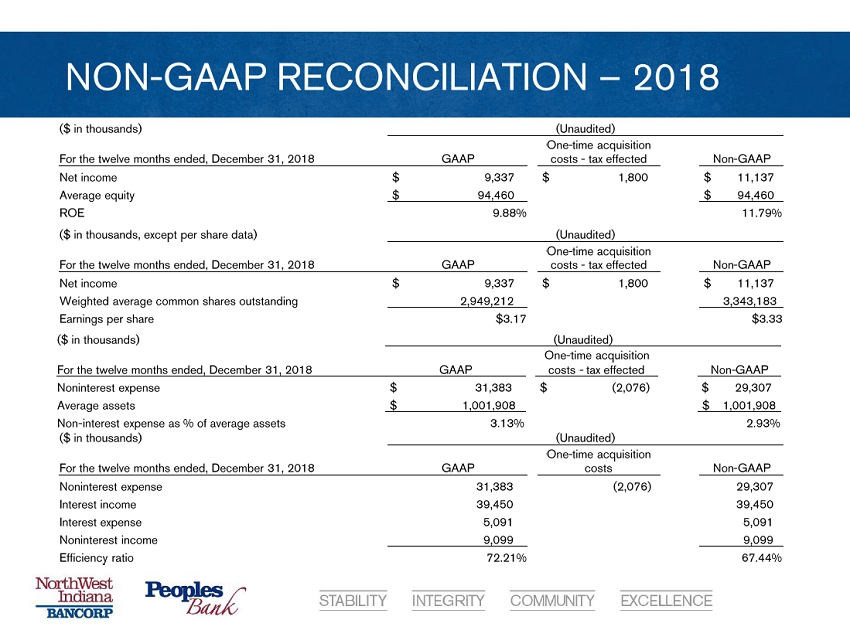
NON - GAAP RECONCILIATION – 2018 ($ in thousands) (Unaudited) For the twelve months ended, December 31, 2018 GAAP One - time acquisition costs - tax effected Non - GAAP Net income $ 9,337 $ 1,800 $ 11,137 Average equity $ 94,460 $ 94,460 ROE 9.88% 11.79% ($ in thousands, except per share data) (Unaudited) For the twelve months ended, December 31, 2018 GAAP One - time acquisition costs - tax effected Non - GAAP Net income $ 9,337 $ 1,800 $ 11,137 Weighted average common shares outstanding 2,949,212 3,343,183 Earnings per share $3.17 $3.33 ($ in thousands) (Unaudited) For the twelve months ended, December 31, 2018 GAAP One - time acquisition costs - tax effected Non - GAAP Noninterest expense $ 31,383 $ (2,076) $ 29,307 Average assets $ 1,001,908 $ 1,001,908 Non - interest expense as % of average assets 3.13% 2.93% ($ in thousands) (Unaudited) For the twelve months ended, December 31, 2018 GAAP One - time acquisition costs Non - GAAP Noninterest expense 31,383 (2,076) 29,307 Interest income 39,450 39,450 Interest expense 5,091 5,091 Noninterest income 9,099 9,099 Efficiency ratio 72.21% 67.44%