FOR IMMEDIATE RELEASE JANUARY 28, 2025 | FOR FURTHER INFORMATION CONTACT SHAREHOLDER SERVICES (219) 853-7575 | |||||||
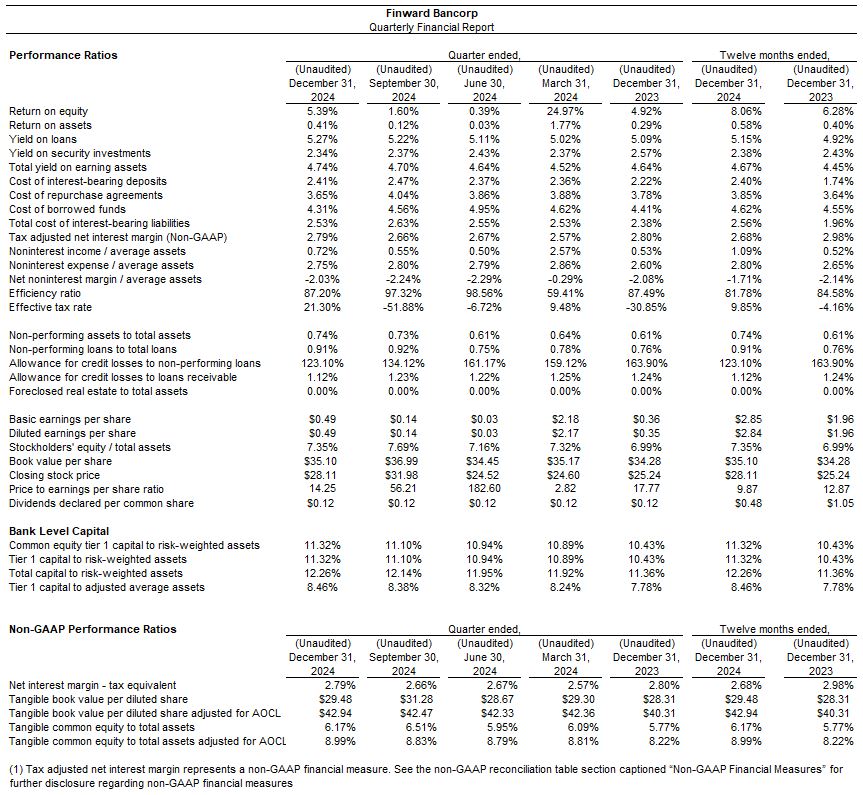
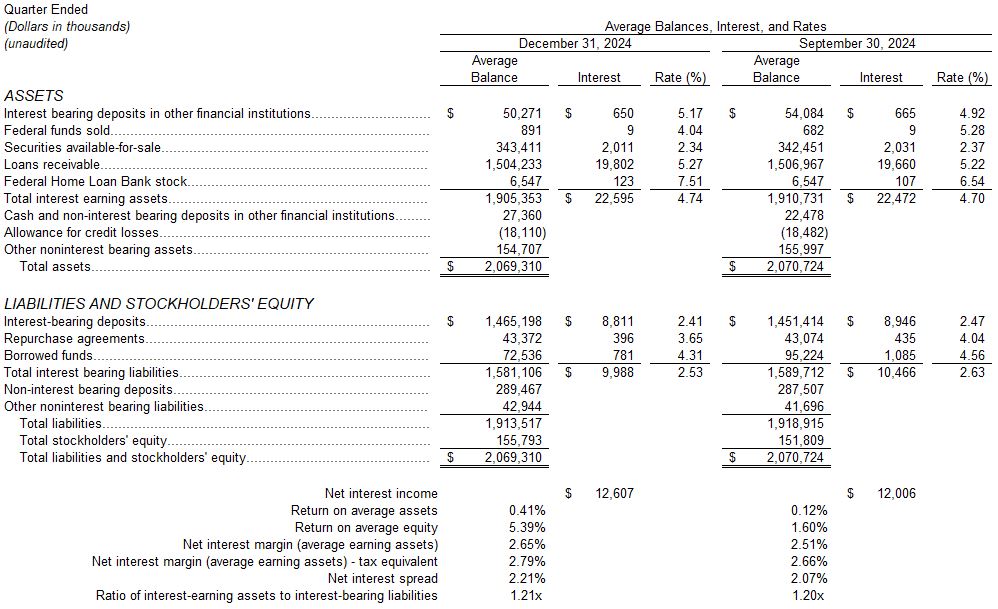
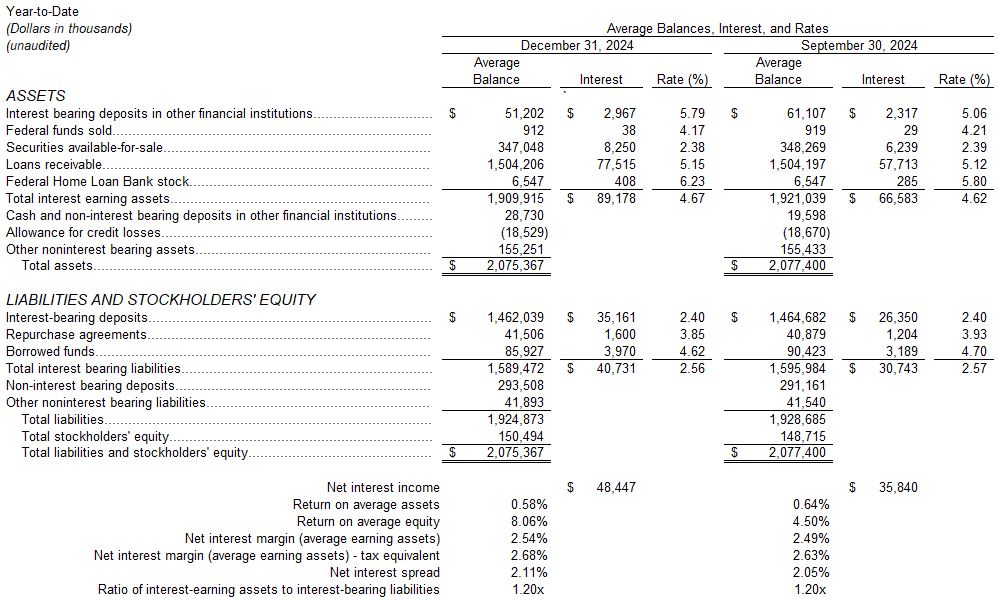
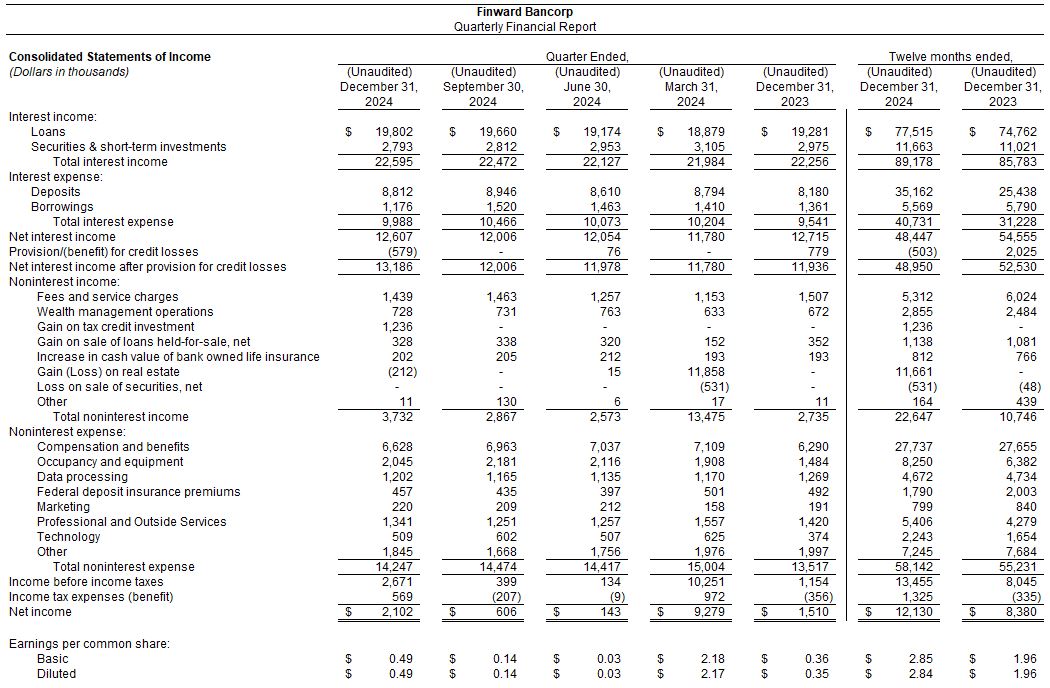
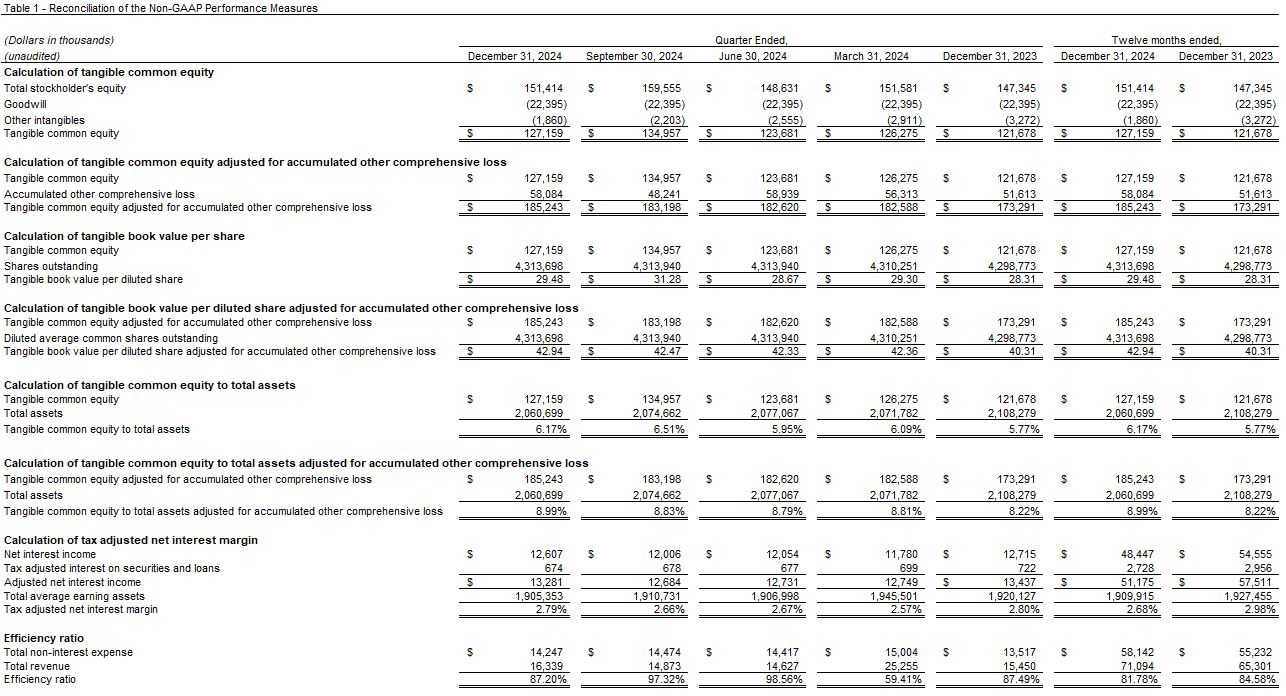
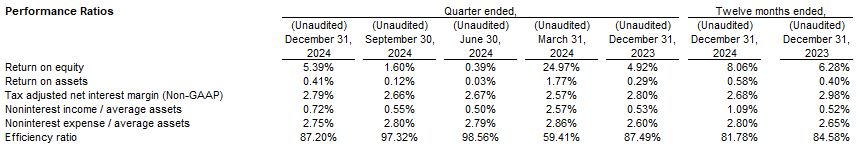
| ● | Net Interest Margin - The net interest margin for the three months ended December 31, 2024, was 2.65%, compared to 2.51% for the three months ended September 30, 2024. The tax-adjusted net interest margin (a non-GAAP measure) for the three months ended December 31, 2024, was 2.79%, compared to 2.66% for the three months ended September 30, 2024. The net interest margin for the twelve months ended December 31, 2024, was 2.54%, compared to 2.83% for the twelve months ended December 31, 2023. The tax-adjusted net interest margin (a non-GAAP measure) for the twelve months ended December 31, 2024, was 2.68%, compared to 2.98% for the twelve months ended December 31, 2023. The increased net interest margin for the three months ended December 31, 2024 compared to September 30, 2024 is primarily the result of increased yields on the Bank’s loan portfolio, combined with reduced deposit and borrowing costs as a result of the Federal Reserve’s continued reduction of federal funds rates during the quarter. See Table 1 at the end of this press release for a reconciliation of the tax-adjusted net interest margin to the GAAP net interest margin. | |||||||
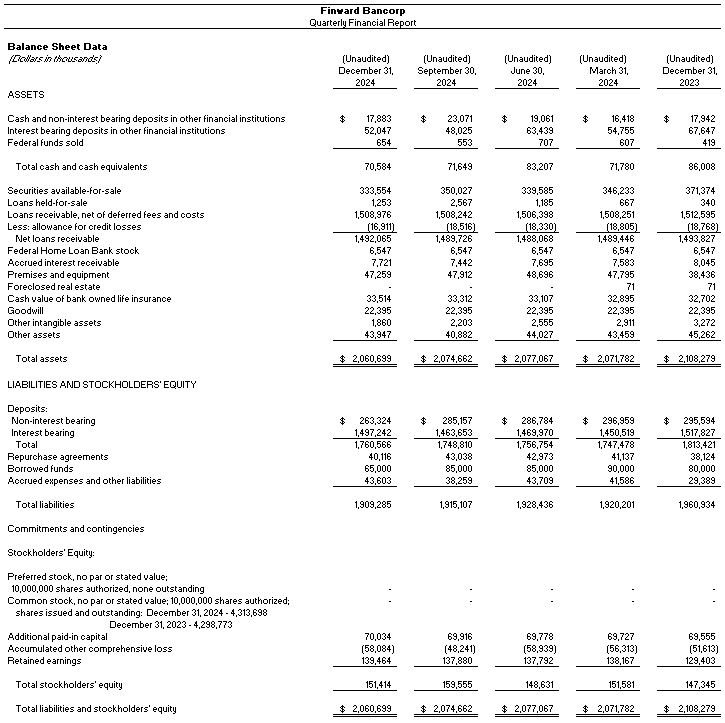
| ● | Funding - As of December 31, 2024, deposits totaled $1.8 billion, an increase of $11.8 million or 0.7%, compared to September 30, 2024. As of December 31, 2024, non-interest-bearing deposits totaled $263.3 million, a decrease of $21.8 million or 7.7%, compared to September 30, 2024. Core deposits totaled $1.2 billion at both December 31, 2024, and September 30, 2024. Core deposits include checking, savings, and money market accounts and represented 68.2% of the Bancorp’s total deposits at December 31, 2024. As of December 31, 2024, balances for certificates of deposit totaled $560.3 million, compared to $562.2 million on September 30, 2024, a decrease of $2.0 million or 0.4%. The increase in total portfolio deposits is primarily related to cyclical flows and continued adjustments to deposit pricing. The decrease in non-interest-bearing deposits is primarily attributable to regular outflow of business-related checking deposits at year-end which tend to return in subsequent periods. In addition, as of December 31, 2024, borrowings and repurchase agreements totaled $105.0 million, a decrease of $22.9 million or 17.9%, compared to September 30, 2024. The decrease in short-term borrowings was the result of cyclical inflows and outflows of interest-earning assets and interest-bearing liabilities. As of December 31, 2024, 72% of our deposits are fully FDIC insured, and another 9% are further backed by the Indiana Public Deposit Insurance Fund. The Bancorp’s liquidity position remains strong with solid core deposit customer relationships, excess cash, debt securities, contractual loan repayments, and access to diversified borrowing sources. As of December 31, 2024, the Bancorp had available liquidity of $687 million including borrowing capacity from the FHLB and Federal Reserve facilities. | |||||||
| ● | Securities Portfolio - Securities available for sale balances decreased by $16.5 million to $333.6 million as of December 31, 2024, compared to $350.0 million as of September 30, 2024. The decrease in securities available for sale was due to a combination of portfolio runoff and an increase of accumulated other comprehensive loss ("AOCL"). AOCL was $58.1 million as of December 31, 2024, compared to $48.2 million on September 30, 2024, a decline of $9.8 million, or 20.4%. The yield on the securities portfolio decreased to 2.34% for the three months ended December 31, 2024, down from 2.37% for the three months ended September 30, 2024. Management did not execute any securities sale transactions during the quarter but will continue to monitor the securities portfolio for additional restructuring opportunities. | |||||||
| ● | Lending - The Bank’s aggregate loan portfolio totaled $1.5 billion on both December 31, 2024, and September 30, 2024. During the three months ended December 31, 2024, the Bank originated $59.2 million in new commercial loans, compared to $70.4 million during the three months ended September 30, 2024, and $47.5 million during the three months ended December 31, 2023. The loan portfolio represents 79.3% of earning assets and is comprised of 63.0% commercial-related credits. At December 31, 2024, the Bancorp’s portfolio loan balances in commercial real estate owner occupied properties totaled $246.6 million or 16.3% of total loan balances and commercial real estate non-owner-occupied properties totaled $305.1 million or 20.2% of total loan balances. Of the $305.1 million in commercial real estate non-owner-occupied properties balances, loans collateralized by office buildings represented $38.5 million or 2.5% of total loan balances. | |||||||
| ● | Gain on Sale of Loans - Gains from the sale of loans totaled $1.1 million for both the twelve months ended December 31, 2024, and 2023. During the twelve months ended December 31, 2024, the Bank originated $36.8 million in new fixed rate mortgage loans for sale, compared to $38.0 million during the twelve months ended December 31, 2023. During the twelve months ended December 31, 2024, the Bank originated $27.4 million in new 1-4 family loans retained in its portfolio, compared to $41.6 million during the twelve months ended December 31, 2023. Total 1-4 family originations for the quarter ended December 31, 2024, totaled $25.4 million, an increase of $5.3 million compared to $20.1 million for the quarter ended September 30, 2024. The retained loans are primarily construction loans and adjustable-rate loans with a fixed-rate period of 7 years or less. The Bank continues to sell longer-duration fixed rate mortgages into the secondary market. | |||||||
| ● | Gain on Tax Credit Investment - During the three months ended December 31, 2024, the Bank successfully concluded a long term, non-controlling interest in a partnership established to facilitate tax credit investments. Upon the termination of the partnership, the Bank recognized a one-time gain of $1.2 million recognized through noninterest income. The proceeds from the dissolution of this tax credit investment will contribute to the Bank’s financial position, thereby supporting ongoing strategic initiatives and operational priorities. | |||||||
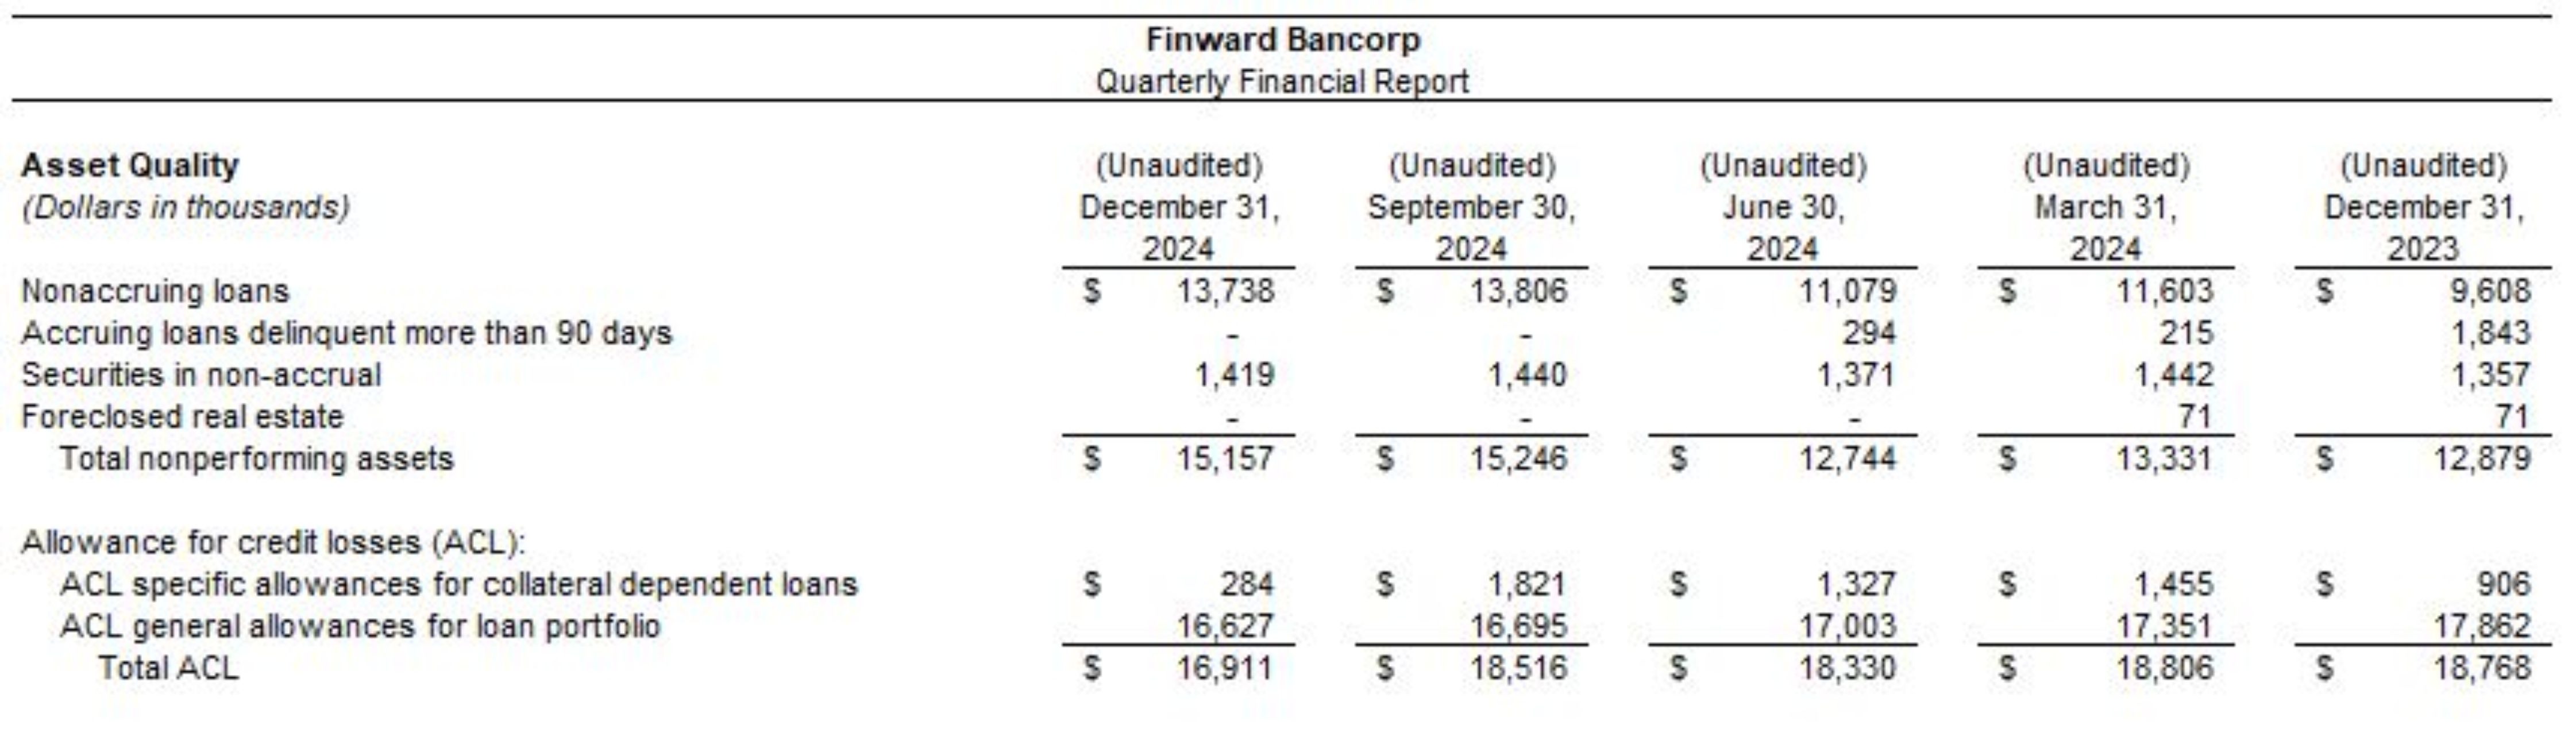
| ● | Asset Quality - At December 31, 2024, non-performing loans totaled $13.7 million, compared to $13.8 million at September 30, 2024, a decrease of $68 thousand or 0.5%. The Bank’s ratio of non-performing loans to total loans was 0.91% at December 31, 2024, compared to 0.92% at September 30, 2024. The Bank’s ratio of non-performing assets to total assets was 0.74% at December 31, 2024, compared to 0.73% at September 30, 2024. Management maintains a vigilant oversight of nonperforming loans through proactive relationship management. The allowance for credit losses (ACL) on loans totaled $16.9 million at December 31, 2024, or 1.12% of total loans receivable, compared to $18.5 million at September 30, 2024, or 1.23% of total loans receivable, a decrease of $1.6 million or 8.7% and is considered adequate by management. The Bank’s unused commitment reserve, included in other liabilities, totaled $2.7 million at December 31, 2024, compared to $3.9 million at September 30, 2024, a decrease of $1.2 million or 30%. For the quarter ended December 31, 2024, the Bank recorded a net negative provision for credit loss expense totaling $579 thousand based on a decline in individually assessed loans balances, historical loss rate updates, migration of loan and unfunded commitment segment balances, and other factors within the Bank’s ACL modeling. The fourth quarter’s provision expense consisted of a $597 thousand provision for credit losses on loans, and a $1.2 million reversal of provision for credit losses on unused commitments. The decrease in the Bank’s unused commitment reserve was primarily due to reduced unused commitment balances and other factors. For the quarter ended December 31, 2024, net charge-offs, totaled $2.2 million. Most of these charge-offs involved a small number of commercial or multifamily-related loans which were previously monitored and had specific allocations toward individual impairment or contributed to higher expected loss rates within the Bank’s prior ACL balance. For the quarter ended September 30, 2024, the Bank recorded no provision expense and recoveries, net of charge-offs, totaled $186 thousand. The ACL as a percentage of non-performing loans, or coverage ratio, was 123.1% at December 31, 2024 compared to 134.1% at September 30, 2024. | |||||||
| ● | Operating Expenses - Non-interest expense as a percentage of average assets was 2.75% for the quarter ended December 31, 2024, as compared to 2.80% for the quarter ended September 30, 2024. Decreases in non-interest expenses quarter over quarter were primarily attributable to reduced compensation and benefit expenses, and lower occupancy and equipment expenses. The Bank remains focused on identifying additional operating efficiencies and third-party expense reductions. Compensation and benefits expense is up 0.3% for the twelve months ended December 31, 2024, compared to December 31, 2023. | |||||||
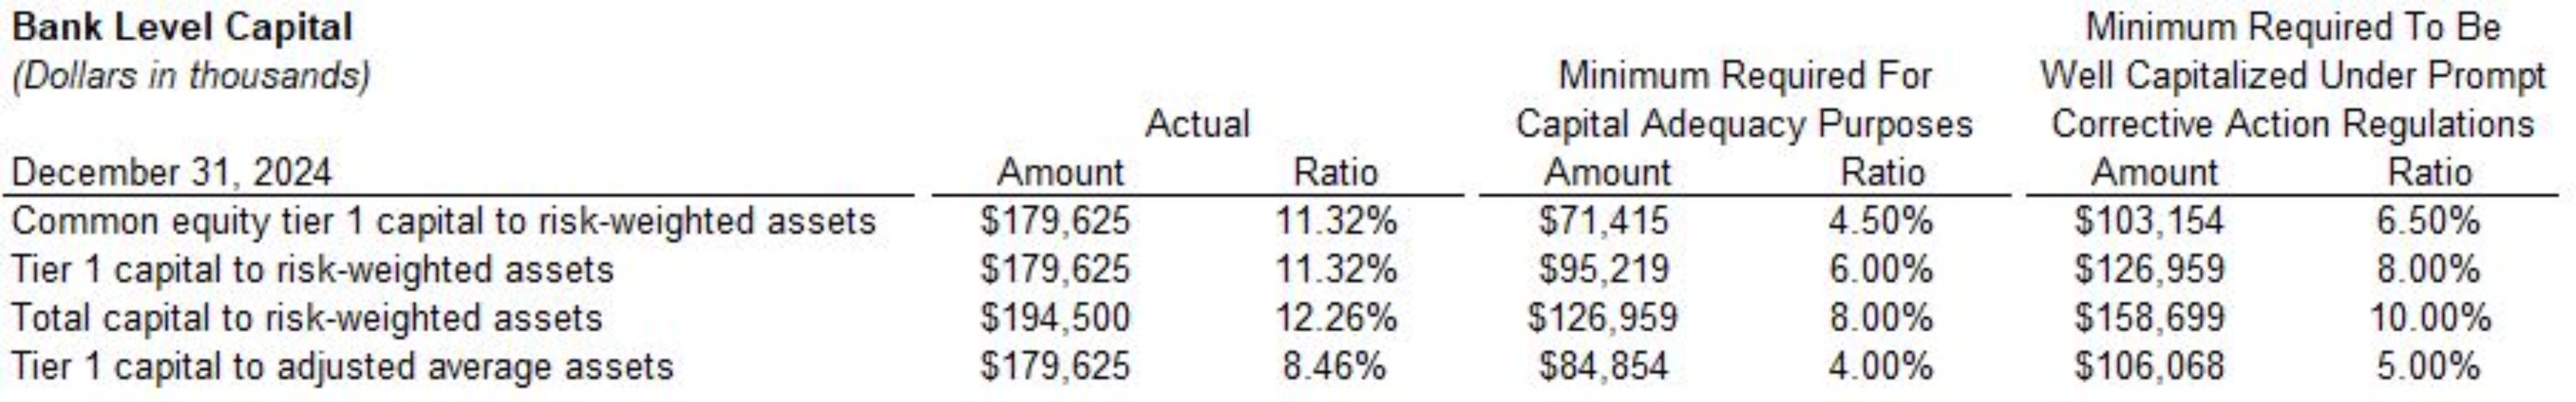
| ● | Capital Adequacy - As of December 31, 2024, the Bank’s tier 1 capital to adjusted average assets ratio was 8.46%, an improvement of 0.08% compared to 8.38% at September 30, 2024. The Bank’s capital continues to exceed all applicable regulatory capital requirements as set forth in 12 C.F.R. § 324. The Bancorp’s tangible book value per share was $29.48 at December 31, 2024, down from $31.28 as of September 30, 2024 (a non-GAAP measure). Tangible common equity to total assets was 6.17% at December 31, 2024, down from 6.51% as of September 30, 2024 (a non-GAAP measure). Excluding accumulated other comprehensive losses, tangible book value per share increased to $42.94 as of December 31, 2024, from $42.47 as of September 30, 2024 (a non-GAAP measure). See Table 1 at the end of this press release for a reconciliation of the tangible book value per share, tangible book value per share adjusted for other accumulated comprehensive losses, tangible common equity as a percentage of total assets, and tangible common equity as a percentage of total assets adjusted for accumulated other comprehensive losses to the related GAAP ratios. | |||||||